
Day 13: Advanced Tool Orchestration & Monitoring
What We’re Building Today
Today we’re constructing a sophisticated research agent that demonstrates enterprise-grade tool orchestration. You’ll implement parallel tool execution, security validation, cost tracking, and failure recovery - the same patterns used by companies processing millions of AI requests daily.
Key Components:
Multi-tool research pipeline with source validation
Parallel execution engine with resource throttling
Security incident response system
Cost tracking and budget management
Failure recovery with circuit breakers
The Production Reality
When Netflix’s recommendation system processes 200+ million user interactions daily, or when Google’s search handles 8.5 billion queries, they rely on sophisticated orchestration systems. Your research agent will use the same architectural patterns - just at a smaller scale.
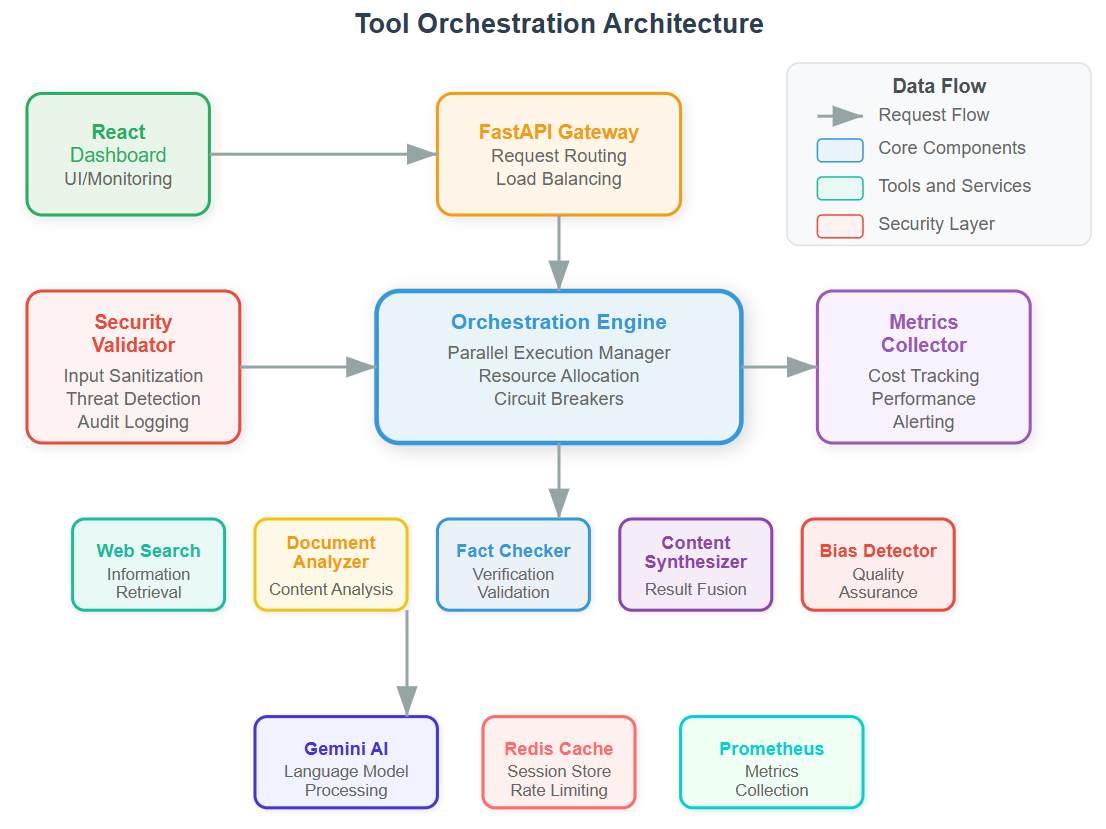
Core Architecture: The Orchestration Engine
Think of tool orchestration like conducting a symphony. Each tool is an instrument that must play at precisely the right time, with the right intensity, while monitoring for mistakes.
Component Breakdown
Tool Chain Manager: Routes requests through validation, execution, and verification stages. It’s your traffic controller ensuring no tool runs without proper authorization.
Parallel Execution Engine: Manages concurrent tool calls with resource limits. Real systems like Stripe’s payment processing use similar patterns to handle thousands of simultaneous transactions safely.
Security Validator: Every tool interaction passes through security checks - input sanitization, output verification, and anomaly detection. This prevents the research agent from being exploited or returning malicious content.
Cost Tracker: Monitors API calls, compute usage, and processing time. Production systems at scale require granular cost visibility to prevent budget overruns.
The Data Flow Journey
Request Ingestion: Research query arrives with metadata and security context
Tool Selection: AI determines which tools are needed and in what sequence
Parallel Orchestration: Multiple tools execute simultaneously within resource constraints
Validation Pipeline: Each tool’s output undergoes security and quality checks
Result Synthesis: Validated outputs combine into final research report
Monitoring Update: Metrics, costs, and security events logged for analysis
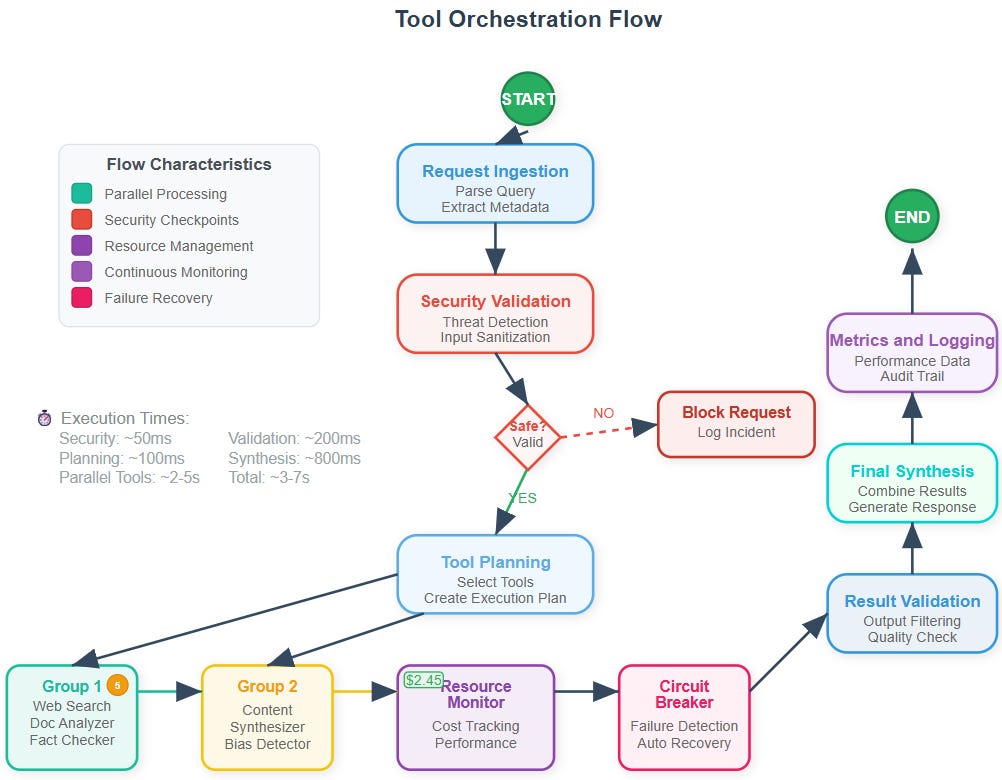
State Management: Beyond Simple Success/Failure
Your orchestration system tracks multiple states simultaneously - execution status, security posture, resource utilization, and cost accumulation. This multi-dimensional state management mirrors how AWS Lambda manages millions of function executions.
Key States:
INITIALIZING: Setting up security context and resource allocationORCHESTRATING: Managing parallel tool executionVALIDATING: Security and quality verification in progressSYNTHESIZING: Combining validated resultsMONITORING: Logging metrics and updating cost tracking
Security-First Tool Orchestration
Unlike simple tool calling, production orchestration requires defense-in-depth security:
Input Validation: Every tool parameter sanitized before execution Output Filtering: Results screened for sensitive data or malicious content
Resource Isolation: Each tool runs in isolated execution contexts Audit Logging: Complete trail of who requested what, when, and why
Failure Recovery Patterns
When tools fail (and they will), your system needs graceful degradation. We implement circuit breakers, retry logic with exponential backoff, and fallback strategies - the same patterns used by resilient systems like GitHub’s API infrastructure.
Recovery Strategies:
Fast Fail: Immediate termination for security violations
Retry with Backoff: Temporary failures get multiple attempts
Graceful Degradation: Partial results when some tools fail
Circuit Breaking: Disable failing tools temporarily
Cost Optimization in Practice
Every API call costs money. Your research agent tracks costs per request, per tool, and per user. This granular tracking enables intelligent routing - using expensive tools only when cheaper alternatives fail to provide sufficient quality.
The Research Agent Implementation
Your final system combines web search, document analysis, fact-checking, and synthesis into a unified research pipeline. Each component validates sources, checks for bias, and maintains audit trails - essential for any system handling information that influences decisions.
Production Insights:
Tool selection impacts both cost and quality
Parallel execution reduces latency but increases complexity
Security validation adds overhead but prevents catastrophic failures
Monitoring data drives optimization decisions
Success Metrics
By day’s end, you’ll have a research agent that:
Executes multiple tools in parallel safely
Tracks costs in real-time
Recovers gracefully from failures
Maintains security through the entire pipeline
Provides audit trails for compliance
This isn’t just a learning exercise - it’s the foundation for production AI systems that handle real-world complexity with enterprise-grade reliability.
Implementation Guide
GitHub Link:
https://github.com/sysdr/ai-agent-mastery-p/tree/main/day13/ai-agent-orchestration
Prerequisites and Environment Setup
Before we begin building, ensure you have these tools installed:
Python 3.11 or higher
Node.js 18 or higher
Git
Gemini AI API key from Google
Docker (optional for containerized deployment)
Phase 1: Project Structure Creation
Step 1: Initialize Your Workspace
Create your project directory and navigate into it:
mkdir ai-agent-orchestration
cd ai-agent-orchestration
Create the complete directory structure:
# Backend structure
mkdir -p backend/{app,tests,config,tools,monitoring,security}
mkdir -p backend/app/{orchestrator,agents,validators,trackers,recovery}

# Frontend structure
mkdir -p frontend/{src,public,tests}
mkdir -p frontend/src/{components,pages,hooks,utils,services}

# Docker and scripts
mkdir -p {docker,scripts,docs}
Step 2: Environment Configuration
Set up your environment variables by creating a .env file in the backend directory:
cd backendReplace your_gemini_api_key_here with your actual Gemini API key.
Phase 2: Backend Implementation
Step 3: Dependencies Installation
Create your Python requirements file:
requirements.txt Set up your Python environment
Step 4: Core Application Structure
You’ll need to implement several key files. Start with the main application entry point (app/main.py), then build the orchestration engine, security validator, cost tracker, and monitoring components. Each component should follow the architectural patterns described above.
The orchestration engine will coordinate all tool execution, while the security validator ensures every request is safe. The cost tracker monitors expenses in real-time, and the failure handler implements recovery strategies.
Step 5: Testing Your Backend
Create comprehensive tests to verify each component:
# Test individual components
python -c “from app.orchestrator.orchestration_engine import OrchestrationEngine; print(’✅ Orchestration Engine working’)”

python -c “from app.security.security_validator import SecurityValidator; print(’✅ Security Validator working’)”

python -c “from app.trackers.cost_tracker import CostTracker; print(’✅ Cost Tracker working’)”
Run your test suite:
python -m pytest tests/ -v
Expected Results:
All tests should pass
No import errors
Components initialize successfully
Step 6: Launch Backend Service
Start your FastAPI server:
python app/main.pyVerify it’s working:
curl http://localhost:8000/api/statusPhase 3: Frontend Dashboard
Step 7: React Application Setup
Navigate to your frontend directory and set up the React application:
cd frontendCreate your package.json:
Install dependencies:
npm installStep 8: Dashboard Implementation
Build your React dashboard with real-time monitoring capabilities. The dashboard should display system status, active orchestrations, cost tracking, and security metrics. Include interactive charts showing tool usage distribution and performance analytics.
Step 9: Frontend Testing
Launch your React development server:
npm startWorking Demo :
Assignment and Next Steps
Homework Assignment:
Enhanced Security: Add rate limiting per IP address
Cost Optimization: Implement tool caching for repeated queries
Monitoring Extension: Add custom dashboard widgets
Tool Integration: Connect an additional external API
Performance Testing: Measure system limits with 100 concurrent users
Solution Hints:
Use Redis for IP-based rate limiting
Implement cache with TTL based on query similarity
Create React components for custom metrics
Follow the same tool interface patterns for new APIs
Use tools like Apache Bench or Artillery for load testing
The github link doesnt work