
Day 21: Enterprise Multi-Agent System Integration & Validation
Building Production-Ready AI Agent Orchestration with Security & Compliance
What We’re Building Today
Today we’re assembling the ultimate enterprise AI agent ecosystem - a self-healing multi-agent orchestra that monitors itself, recovers from failures, and maintains compliance automatically. Think of it as Netflix’s chaos engineering meeting OpenAI’s agent swarm, with enterprise security wrapped around everything.
By the end of this lesson, you’ll have a working system with:
Multi-agent orchestration with automatic failover
Real-time security monitoring and threat detection
Self-healing capabilities that recover without human intervention
Compliance automation with audit trails
Live dashboard showing everything in action
The Enterprise Reality Check
When Netflix deploys their recommendation agents or when Stripe’s fraud detection agents process millions of transactions, they don’t just “work” - they survive, adapt, and prove their compliance every second. Your agents need the same resilience.
Here’s what separates a demo from production: it’s not just about making something work once. It’s about making it work reliably, even when things go wrong. Real systems face network failures, API timeouts, sudden traffic spikes, and security threats. Your system needs to handle all of this gracefully.
Core Architecture: The Self-Healing Ecosystem
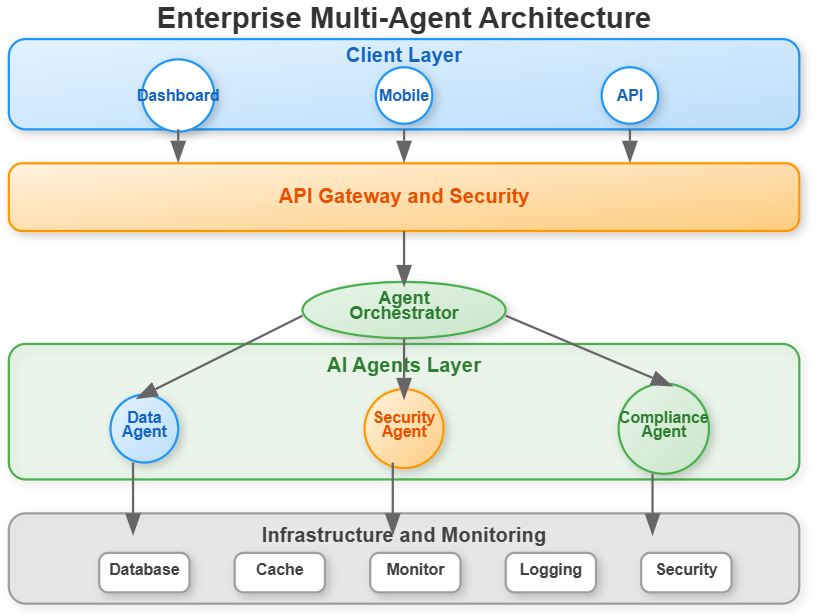
Our system has four critical layers working in harmony:
Agent Orchestration Layer
Multiple specialized agents coordinate through a central orchestrator. Think of it like a conductor leading an orchestra - each musician (agent) has their specialty, but they need coordination to create something beautiful.
Data Processing Agent: Handles data analysis and transformation
Security Agent: Monitors threats and validates security policies
Compliance Agent: Ensures regulatory requirements are met
Each agent maintains its own health metrics and reports status continuously. The orchestrator tracks which agents are healthy, which are struggling, and routes tasks accordingly.
Security & Monitoring Layer
Real-time threat detection, anomaly identification, and security incident response. Think of it as having a dedicated security team watching every agent interaction, 24/7.
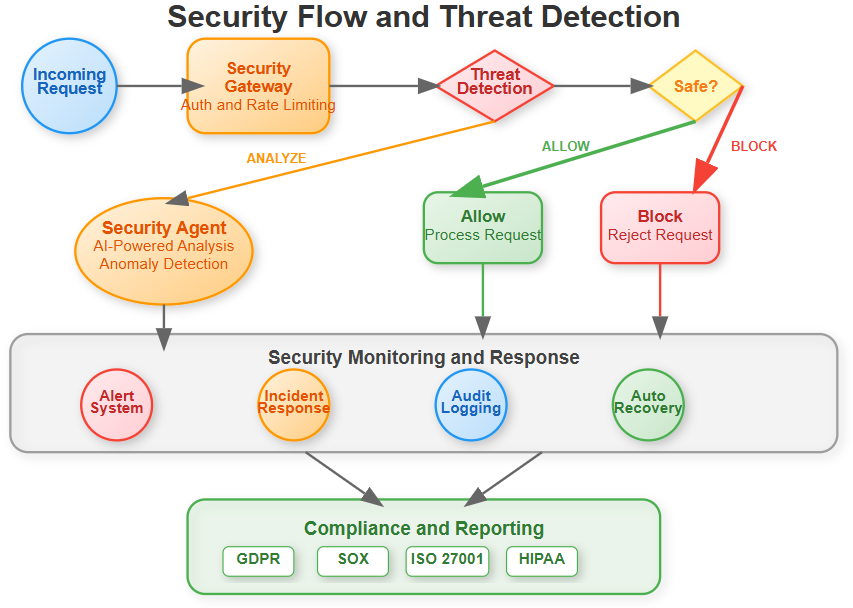
Every request that enters your system goes through multiple security checkpoints:
Authentication and authorization
Rate limiting to prevent abuse
Threat pattern detection
Real-time anomaly scanning
Automatic blocking of suspicious activity
Self-Healing & Recovery Layer
Automated failure detection, graceful degradation, and recovery procedures. When an agent fails, the system doesn’t just restart it - it analyzes why it failed and prevents similar failures.
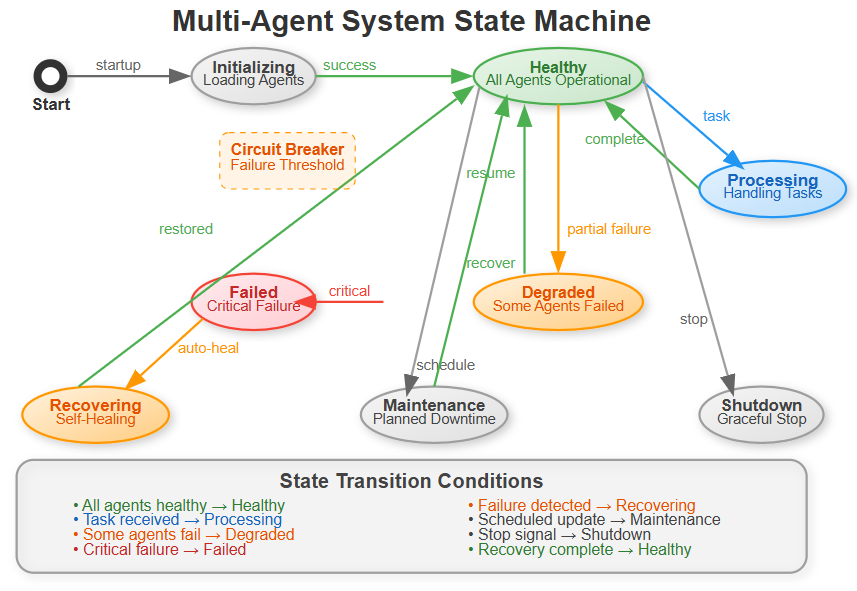
The system moves through different states based on health:
Healthy: All agents operational, processing tasks normally
Processing: Actively handling user requests
Degraded: Some agents failed, but system still functional
Recovering: Self-healing procedures in progress
Failed: Critical failure requiring intervention
The key insight: the system automatically transitions between states. When it detects a problem, it doesn’t wait for you to fix it - it fixes itself.
Compliance & Audit Layer
Automated compliance checking, audit trail generation, and regulatory reporting. Every agent action gets logged, validated, and prepared for audit. This isn’t optional in enterprise systems - regulators require proof of compliance, and manual tracking is error-prone.
Implementation Deep Dive
Multi-Agent Coordination
The orchestrator is the brain of the system. Here’s how it makes intelligent decisions:
class AgentOrchestrator:
    def __init__(self):
        self.agents = {}
        self.health_monitor = HealthMonitor()
        self.security_manager = SecurityManager()

    async def coordinate_agents(self, task):
        # Distribute task across healthy agents
        # Monitor execution in real-time
        # Handle failures gracefully
When a task arrives, the orchestrator:
Selects the appropriate agent based on task type
Checks if that agent is healthy (circuit breaker pattern)
Executes with automatic retry on failure
Falls back to other agents if primary fails
Updates performance metrics for future decisions
Security Integration
Real-time security monitoring wraps every agent interaction. Each API call, data access, and inter-agent communication gets validated against security policies.
The security layer operates on the principle of “defense in depth” - multiple security checkpoints that work together. If one layer misses a threat, others catch it.
Self-Healing Mechanisms
The system continuously monitors agent health, automatically scales resources, and implements circuit breakers to prevent cascade failures. It’s like having an immune system for your AI infrastructure.
Circuit breakers work like this: if an agent fails three times in a row, the circuit “opens” - we stop sending it traffic for 60 seconds. This prevents wasting time on a broken agent and gives it time to recover. After the timeout, we try again (circuit “half-open”). If it succeeds, we resume normal operation (circuit “closed”).
Enterprise Dashboard
A React-based control center showing real-time agent status, security alerts, performance metrics, and compliance reports. Everything a CTO needs to see at 3 AM when things go wrong.
The dashboard updates in real-time using WebSockets - no need to refresh. When an agent fails, you see it immediately. When recovery completes, you see that too.
Production Patterns You’ll Master
Circuit Breaker Pattern: Prevent cascade failures when one agent goes down. Instead of repeatedly trying a broken service, we “open the circuit” and stop sending traffic until it recovers.
Health Check Orchestration: Continuous monitoring with automated remediation. Every 10 seconds, we check each agent’s health. If something’s wrong, we take action immediately.
Security Middleware: Zero-trust security for all agent communications. Never assume anything is safe - validate everything.
Compliance Automation: Automated audit trails and regulatory reporting. GDPR, SOX, HIPAA - we track everything needed for compliance.
Real-World Context
This architecture mirrors how companies like Uber manage their real-time pricing agents, or how financial institutions run their risk assessment AI systems.
Uber’s surge pricing agents need to respond instantly, even when some services fail. They use similar patterns: circuit breakers prevent cascading failures, health monitoring catches problems early, and self-healing keeps the system running.
Financial institutions face even stricter requirements. Every decision must be auditable. Every transaction must be logged. Security cannot be an afterthought. The patterns you’re learning today are battle-tested in these demanding environments.
The difference between a demo and production isn’t just scale - it’s resilience, security, and compliance.
Hands-On Implementation
Github Link:
https://github.com/sysdr/AI-Agent-Mastery/tree/main/day21/enterprise_agent_systemPrerequisites
Before starting, ensure you have:
Python 3.11 or higher
Node.js 18 or higher
A Gemini API key (get it free from Google AI Studio)
Step 1: Project Setup
Run the implementation script provided. It creates the complete project structure:
chmod +x enterprise_agent_implementation.sh
./enterprise_agent_implementation.sh
This creates:
Backend directory with FastAPI application
Frontend directory with React dashboard
Configuration files
Test files
Build and deployment scripts
Step 2: Configuration
Navigate to the backend directory and update your environment variables:
cd enterprise_agent_system/backend
nano .env
Update the Gemini API key:
GEMINI_API_KEY=your_actual_api_key_here
The system needs this to power the AI agents. Each agent uses Gemini to process tasks intelligently.
Step 3: Build the System
From the project root, run the build script:
./build.sh
This creates a Python virtual environment, installs all dependencies, and builds the React frontend. Expected output:
Virtual environment created successfully
Python packages installed
Node modules installed
React app built for production
Step 4: Start Services
Launch both backend and frontend:
./start.sh
You should see:
Backend API running on http://localhost:8000
Frontend dashboard on http://localhost:3000
WebSocket connection established
Testing & Verification
Verify Backend Health
Open a new terminal and test the health endpoint:
curl http://localhost:8000/health
Expected response: JSON with system health metrics including CPU usage, memory usage, and health score.
Verify Frontend Dashboard
Open your browser to http://localhost:3000. You should see:
System health card with real-time metrics
Agent status showing all three agents
Performance charts updating automatically
Security status indicators
Check the WebSocket connection indicator in the top right - it should show “Connected” with a green pulse.
Test Agent Orchestration
Execute a task via the API:
curl -X POST http://localhost:8000/agents/execute \
  -H “Content-Type: application/json” \
  -d ‘{”type”:”data_processing”,”data”:”Test data for analysis”}’
Expected response: JSON showing task completion, execution time, and which agent handled it.
Watch the dashboard - you should see the activity reflected in real-time metrics.
Test Different Agent Types
Try the security agent:
curl -X POST http://localhost:8000/agents/execute \
  -H “Content-Type: application/json” \
  -d ‘{”type”:”security_scan”,”data”:”System security check”}’
Try the compliance agent:
curl -X POST http://localhost:8000/agents/execute \
  -H “Content-Type: application/json” \
  -d ‘{”type”:”compliance_check”,”data”:”Regulatory compliance verification”}’
Each agent type processes tasks differently. Watch how the orchestrator routes to the appropriate agent.
Test Self-Healing
Trigger the recovery system:
curl -X POST http://localhost:8000/system/recovery
Expected response: Confirmation that recovery procedures initiated.
Watch the dashboard - the system should automatically detect and recover from any issues. This demonstrates the self-healing capability.
Verify Security Monitoring
Navigate to the Security tab in the dashboard. You should see:
Real-time threat detection status
Any security alerts (simulated)
Security policy enforcement metrics
The security agent continuously scans for anomalies and suspicious patterns.
Verify Compliance Tracking
Navigate to the Compliance tab. You should see:
Audit trail of all system activities
Task executions with timestamps
Agent assignments and results
User actions logged
This audit trail is what regulators require. Every action is tracked and traceable.
Functional Demo Checklist
Verify all features work correctly:
Multi-Agent Coordination
All three agents initialize successfully
Tasks route to correct agents automatically
Different task types handled appropriately
Real-Time Monitoring
Dashboard updates without refresh
Performance charts show live data
System metrics accurate
Security Features
Security alerts display correctly
Threat monitoring active
Request validation working
Self-Healing Capabilities
Circuit breakers activate on failure
Automatic recovery procedures work
System maintains availability during issues
Compliance & Audit
All actions logged to audit trail
Compliance reports generate correctly
Regulatory checks function properly
Understanding What You Built
Let’s break down the key components:
The Orchestrator
Your orchestrator makes intelligent decisions about task routing. When a task arrives, it:
Examines the task type
Checks which agents are healthy
Selects the best agent for the job
Monitors execution
Handles failures automatically
This is crucial for production systems. You can’t assume all services are always available.
Circuit Breakers
Circuit breakers prevent your system from beating its head against a broken service. They work in three states:
Closed (Normal): Everything working, requests flow normally Open (Failed): Too many failures, stop sending requests Half-Open (Testing): Timeout expired, carefully testing if service recovered
This pattern, borrowed from electrical engineering, prevents cascading failures.
Health Monitoring
Your system constantly checks its own health. Every 10 seconds, it:
Measures CPU and memory usage
Tests agent responsiveness
Calculates overall health score
Broadcasts updates to dashboard
When health drops below threshold, automatic remediation begins.
Security Layers
Security isn’t one thing - it’s multiple layers:
Authentication: Who are you?
Authorization: What can you do?
Rate limiting: Are you doing too much?
Threat detection: Are you doing something suspicious?
Audit logging: What did you do?
Each layer catches different types of problems.
Success Criteria
You’ve successfully completed this lesson when:
System Functionality
Dashboard loads without errors
All agents initialize and respond to health checks
Tasks execute successfully for all agent types
Real-time metrics update correctly
WebSocket connection remains stable
Security Features
Security monitoring detects simulated threats
Alert system displays warnings appropriately
Security policies enforce as configured
Incident logging captures events
Self-Healing Capabilities
Circuit breakers activate when agents fail
Automatic recovery restores functionality
Fallback agents handle failed agent tasks
System maintains availability throughout issues
Compliance & Audit
Audit trail captures all activities
Compliance reports generate with accurate data
All actions traceable with timestamps
Audit data persists correctly
Working Code Demo:
Assignment Challenge
Now put your system to the test:
Part 1: Simulate Agent Failure
Stop one of the agents (you can simulate this by overwhelming it with requests or by modifying code to throw errors). Watch your system:
Detect the failure automatically
Activate the circuit breaker
Redistribute workload to healthy agents
Attempt recovery after timeout
Log all events to audit trail
Part 2: Generate Compliance Report
Execute multiple tasks of different types. Then:
Navigate to the Compliance tab
Review the audit trail
Verify all activities logged
Check compliance metrics
Export report data
Part 3: Load Testing
Use multiple terminal windows to send concurrent requests:
# Terminal 1
for i in {1..10}; do
  curl -X POST http://localhost:8000/agents/execute \
    -H “Content-Type: application/json” \
    -d ‘{”type”:”data_processing”,”data”:”Concurrent test ‘$i’”}’ &
done
wait
Observe how the system:
Handles concurrent requests
Maintains performance metrics
Keeps all agents operational
Updates dashboard in real-time
Troubleshooting Common Issues
Backend won’t start
Verify virtual environment activated:
source enterprise_env/bin/activateCheck Gemini API key set correctly in .env file
Ensure port 8000 not already in use
Frontend connection fails
Verify backend running on port 8000
Check browser console for WebSocket errors
Ensure CORS configured correctly (already done in provided code)
Agents not responding
Verify Gemini API key valid and has quota
Check network connectivity to Google AI services
Review backend logs for specific error messages
Dashboard not updating
Verify WebSocket connection indicator shows “Connected”
Check browser developer tools for JavaScript errors
Refresh page and reconnect
What’s Next
You’ve built a production-ready enterprise AI agent system. The patterns you learned - circuit breakers, health monitoring, self-healing, security layers, and compliance automation - are fundamental to real-world AI systems.
These aren’t academic concepts. These are the same patterns used by:
Netflix for streaming reliability
Stripe for payment processing
Uber for real-time pricing
Financial institutions for risk assessment
In Day 22, we’ll build the API Gateway that sits in front of systems like this, adding another layer of security, rate limiting, and traffic management.
Your enterprise AI agent system is ready for the real world - resilient, secure, and audit-ready.
Clean Shutdown
When you’re done testing:
./stop.sh
This gracefully shuts down all services, ensuring clean state for next run.
Key Takeaways
Production systems require resilience - Failures will happen. Design for them.
Security is multi-layered - No single security measure is enough. Use defense in depth.
Self-healing saves downtime - Automatic recovery is faster than human intervention.
Compliance requires automation - Manual tracking doesn’t scale and introduces errors.
Monitoring enables everything else - You can’t fix what you can’t see.
These principles apply beyond AI systems. They’re fundamental to any production service that needs to be reliable, secure, and compliant.
You’re now equipped to build enterprise-grade AI systems that survive in the real world.