
Introduction
This lesson adds production controls for AI request throughput and token spend.
You implement tier-aware throttling before expensive model execution happens.
You also track per-user cost in real time so usage aligns with budget policies.
A live dashboard exposes request, throttle, latency, and budget metrics.
The child project remains self-contained and runnable with local scripts.
Highlights
Token-bucket throttling with
standard,premium, andadmintiersPer-request input/output token accounting converted to USD spend
Budget-alert counters and event timeline for operational visibility
FastAPI endpoints for health, checks, metrics, dashboard, and demo
Dockerized runtime with script-driven lifecycle management
What We Build
Rate-control domain package (
bucket,cost_tracker,metrics,service)API and dashboard surface (
/check,/metrics,/demo,/dashboard,/health)Deterministic demo scenario for non-zero metric updates
Unit and API tests covering behavior and contracts
Operational scripts for start, stop, test, and cleanup
Connection to Previous Lesson
The previous lesson centered on memory behavior and metric observability.
This lesson shifts from observation to enforcement by adding policy controls.
Now the system does not just report usage; it actively regulates it.
Enables Next Lesson
These controls reduce blast radius and cost drift, enabling stronger policy and security hardening in the next lesson.
Architecture Context
Where this component sits
Why it exists
Problem solved
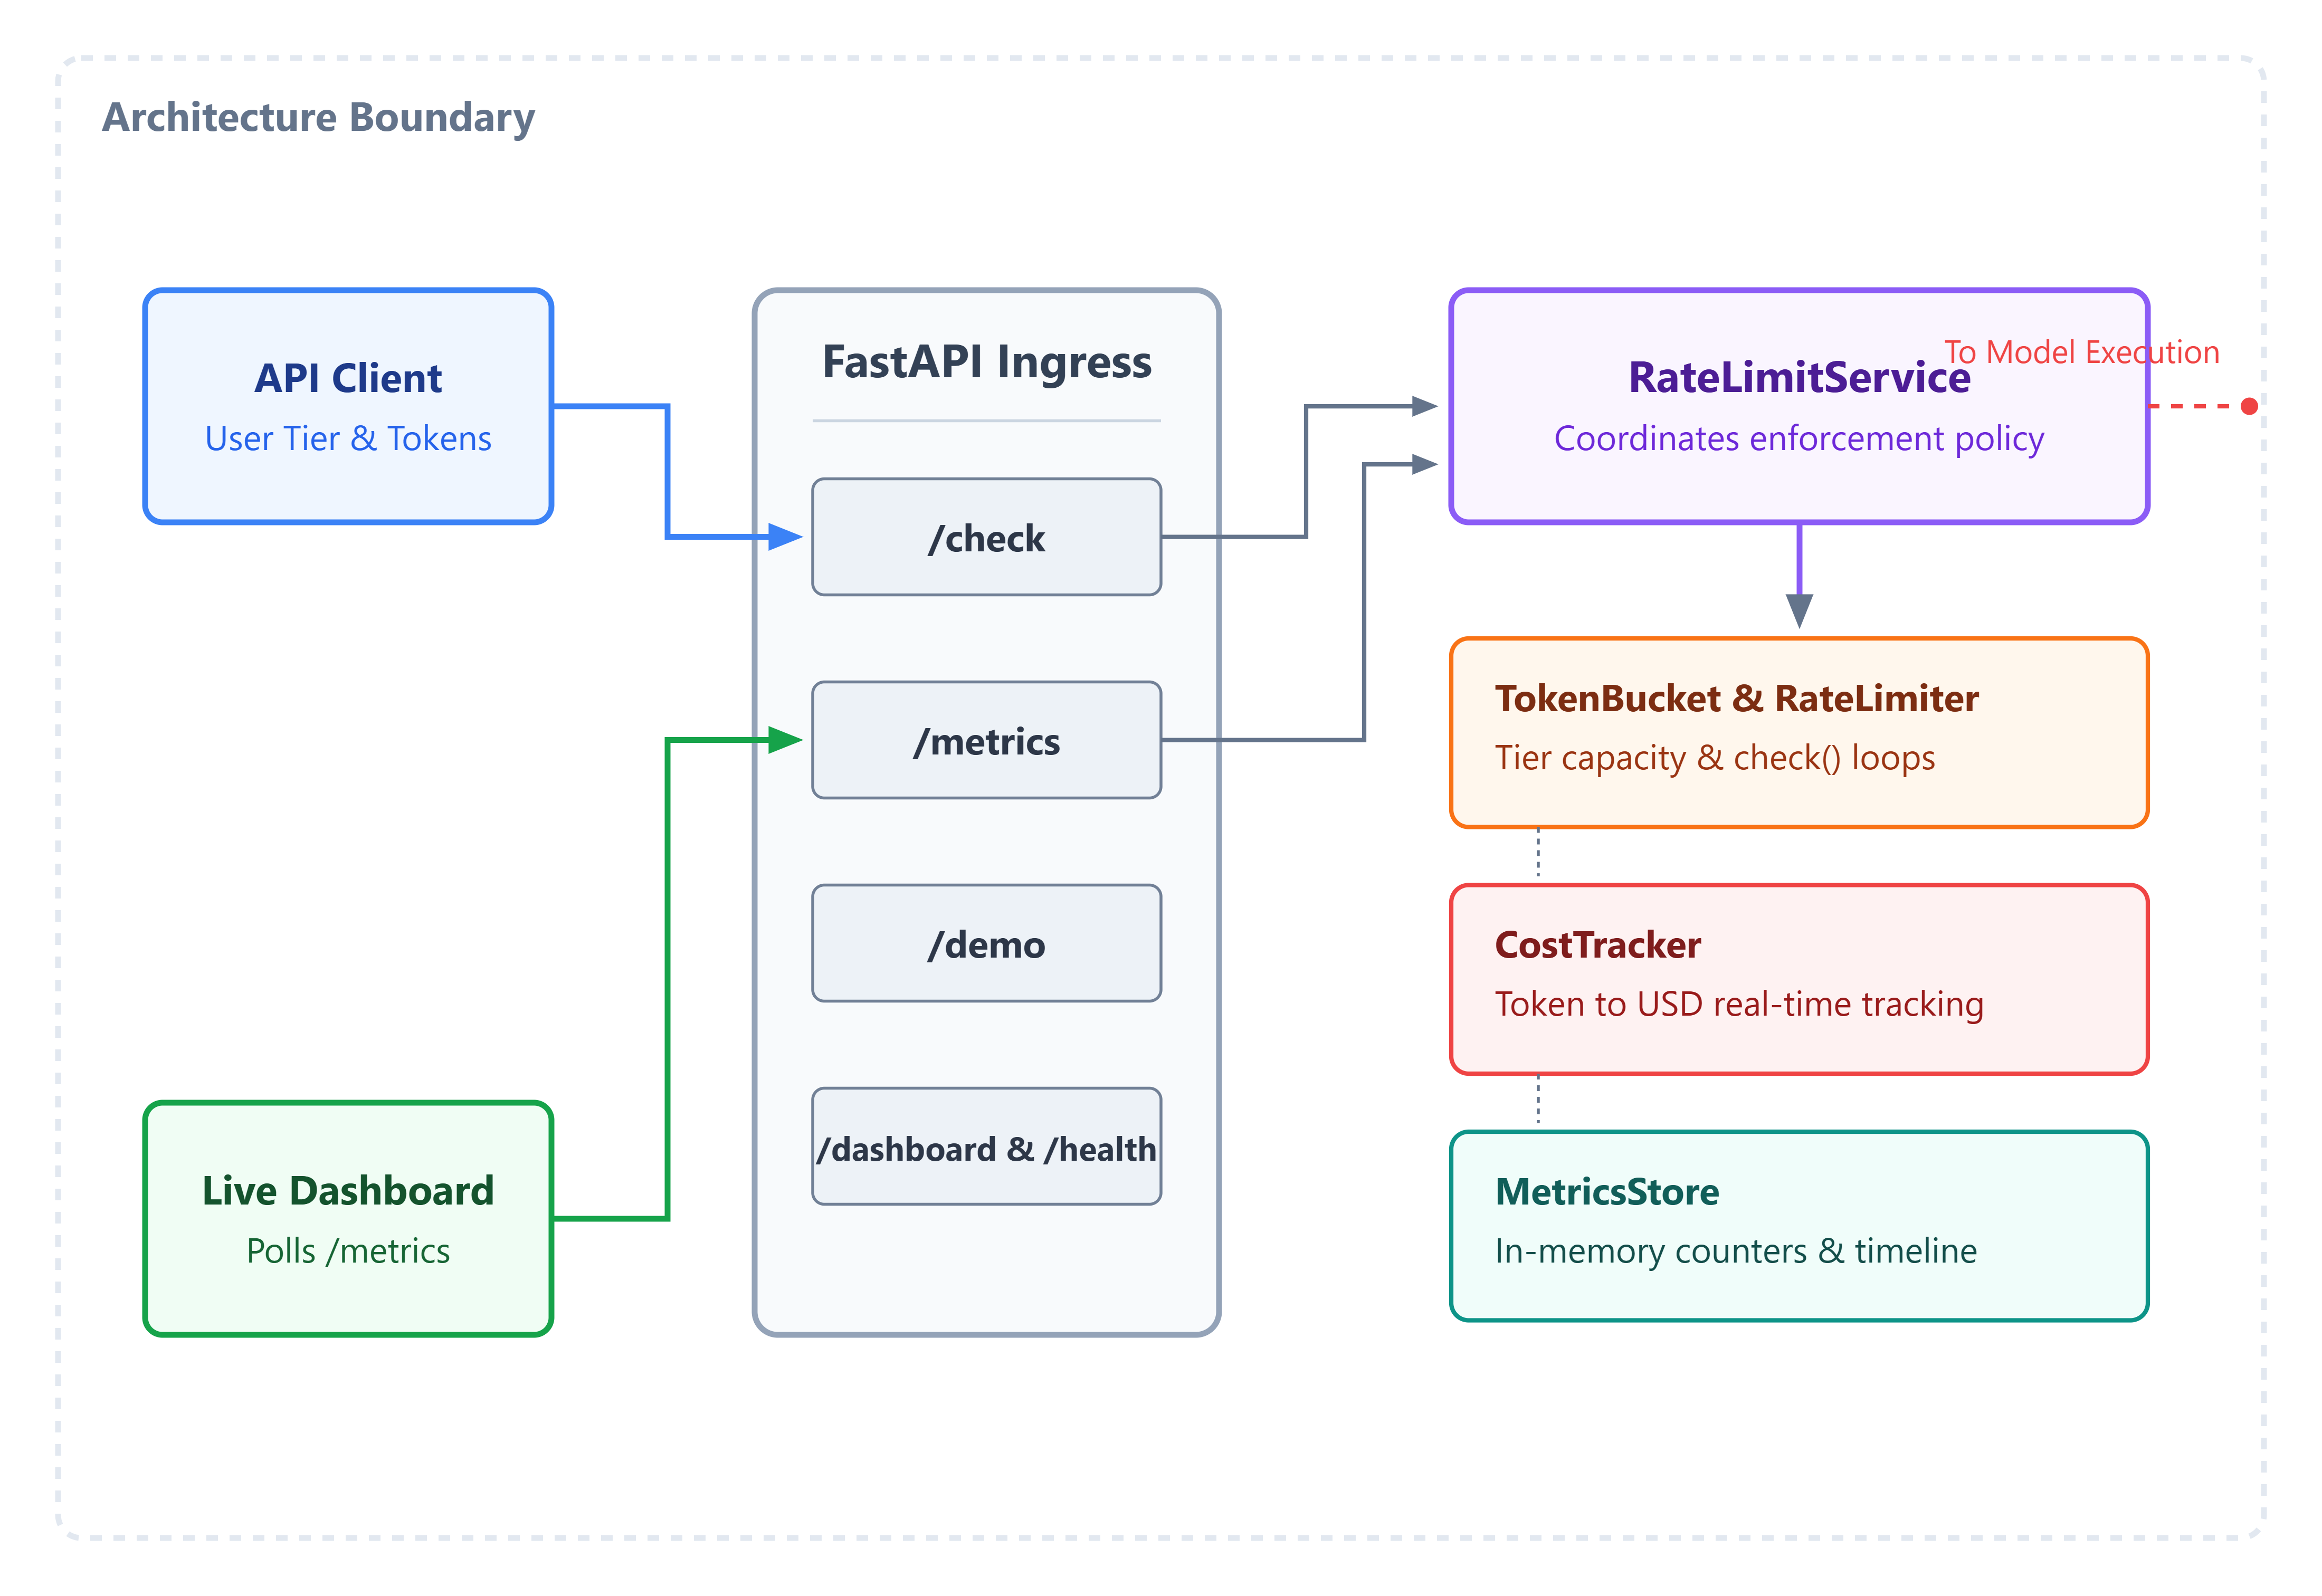
This component sits between request intake and model execution, enforcing throughput and spend constraints before model work begins.
Integration
Integration Components
FastAPI validates request payloads and forwards policy work to the service layer. The service coordinates bucket checks, spend recording, and metric updates. The dashboard polls /metrics and triggers /demo for validation.
Module Objectives Alignment
The module aligns with production goals: stable throughput, controlled cost growth, and measurable system behavior.
Core Concepts
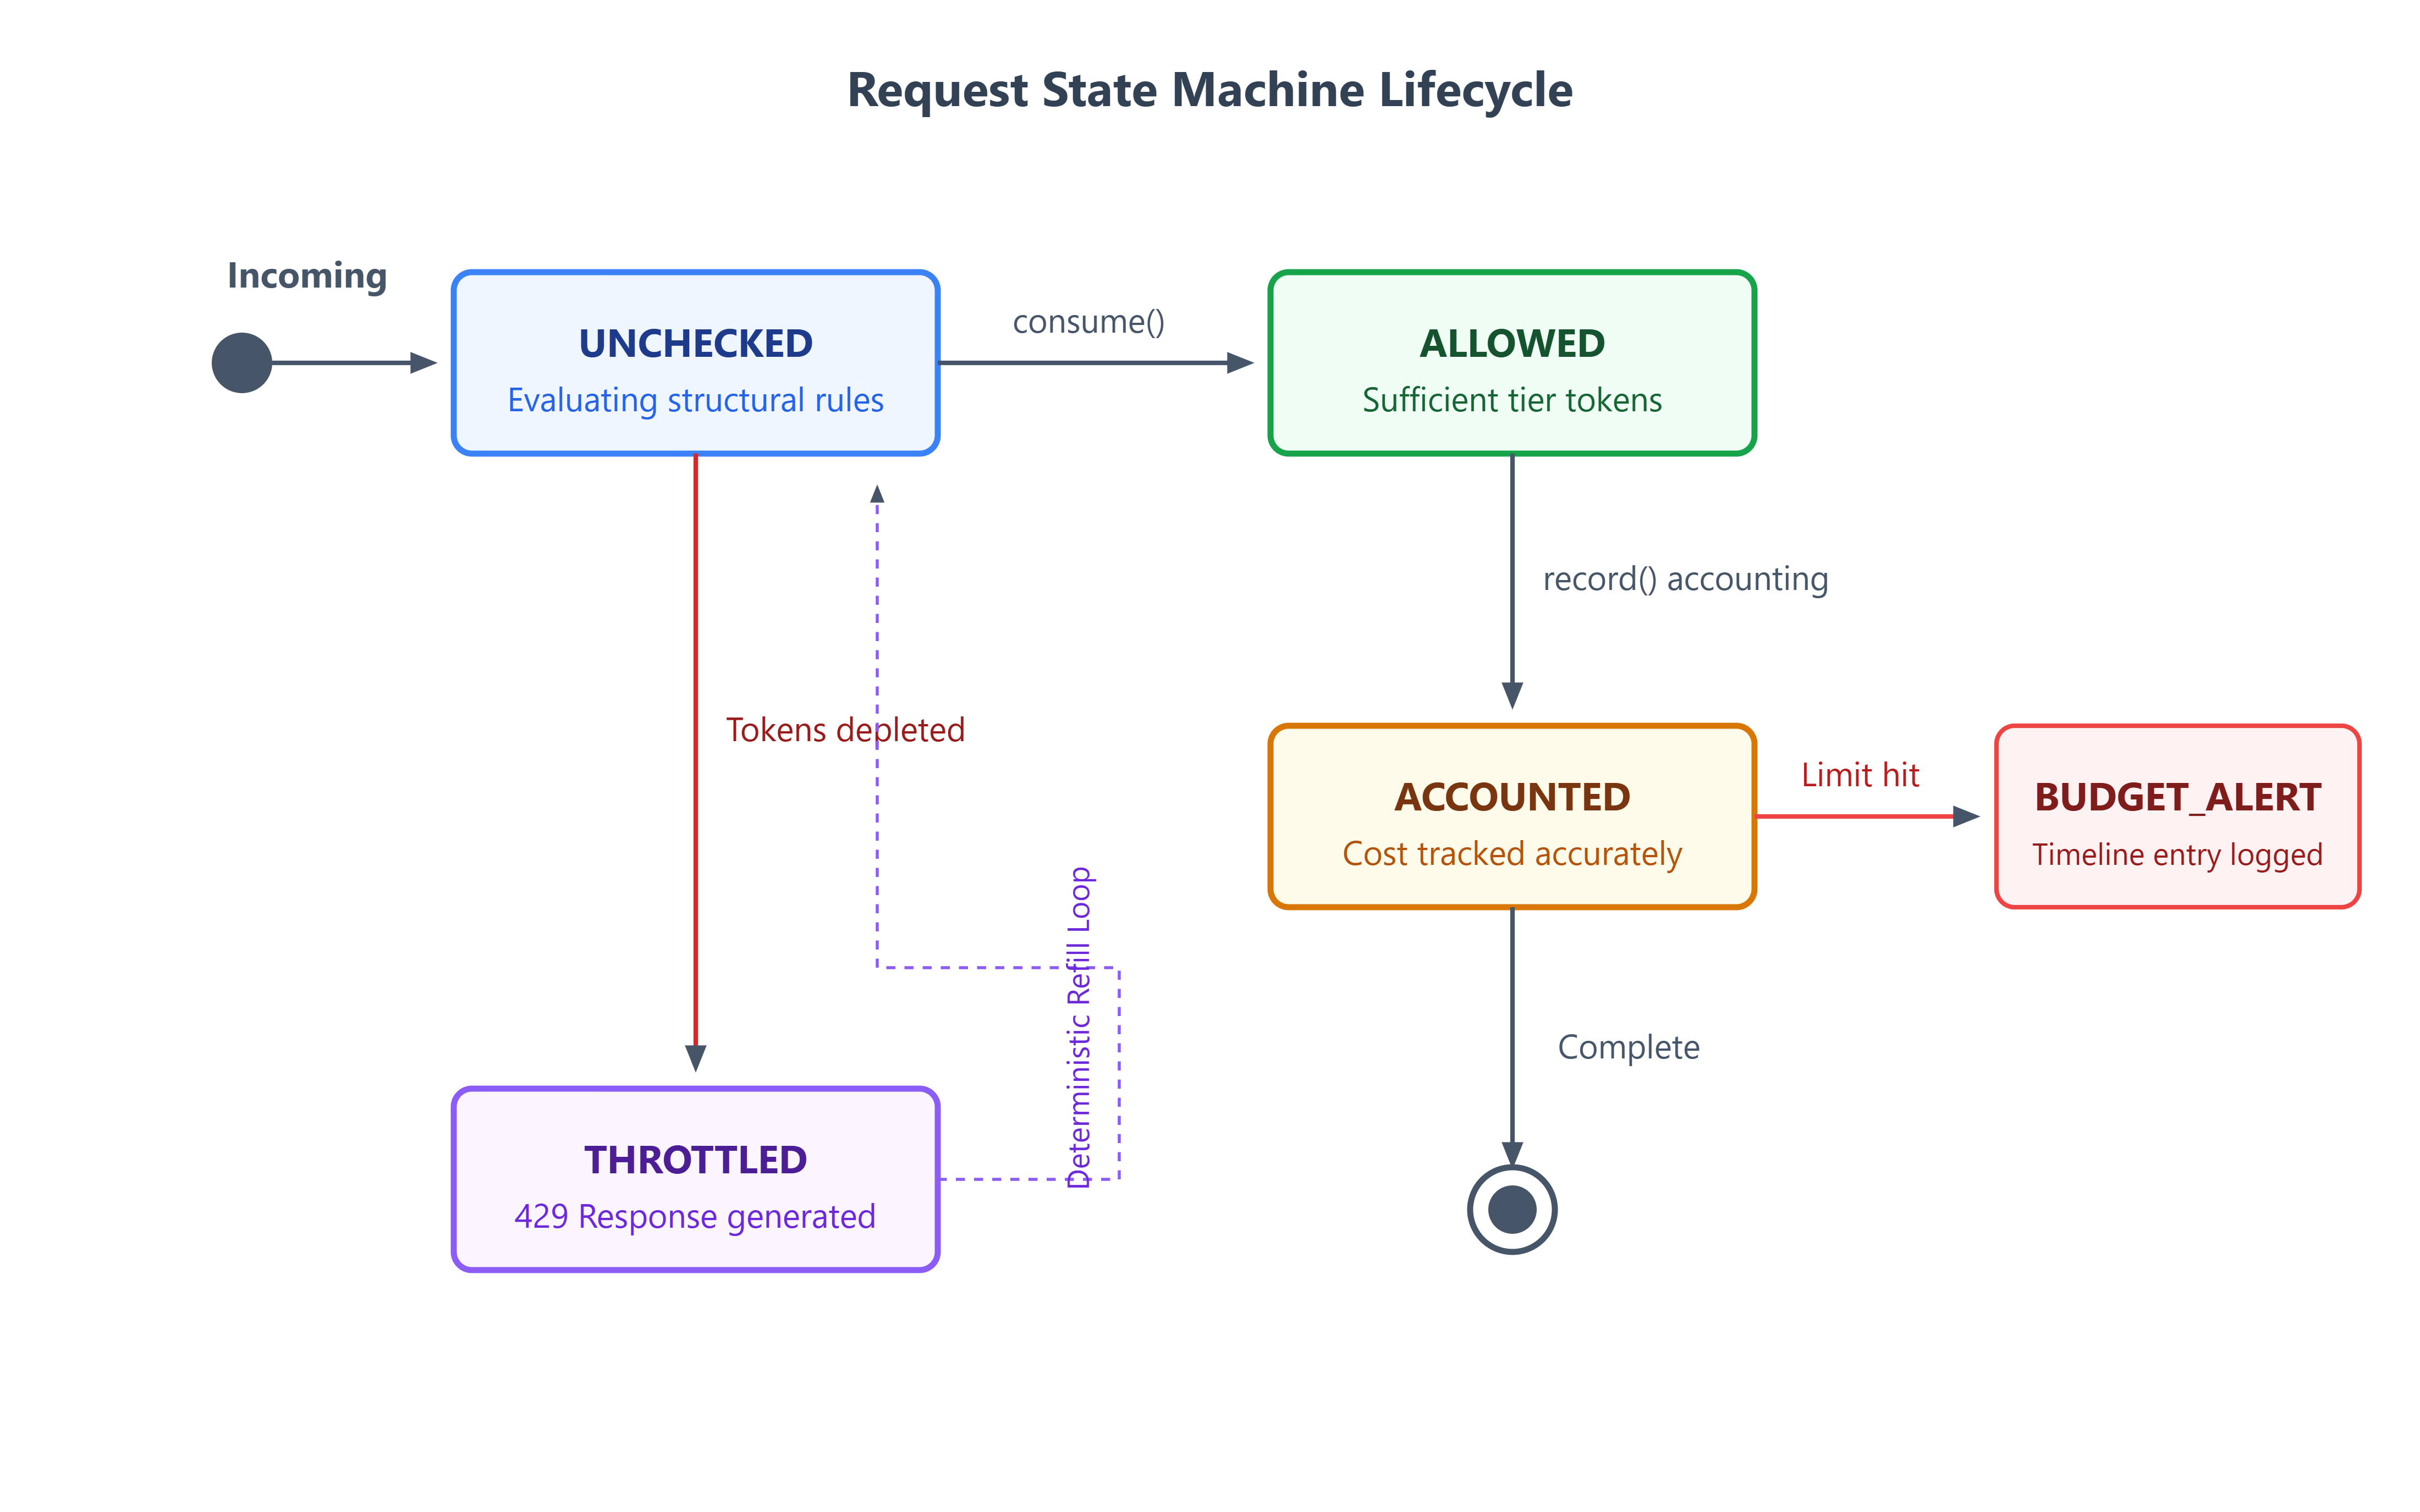
Token bucket is chosen because it allows controlled bursts while limiting sustained traffic. That fits real AI workloads better than fixed-window throttling, which can create boundary spikes.
Tier configuration maps product plans to infrastructure policy. Higher tiers get larger capacity and refill rates without requiring separate code paths.
Cost tracking is done per request to avoid delayed budget surprises. Real-time accounting enables early alerts and tighter operational response.
Metrics are modeled as counters, gauges, and event entries. This supports both dashboard rendering and automated smoke verification.
In-memory state keeps scope simple while preserving interfaces that can move to shared stores later.
Key Insights
Throughput control and cost control must ship together. Request count alone cannot represent AI cost risk, and spend-only controls cannot protect latency under burst load.
A common mistake is applying checks too late in the pipeline. Guardrails should run before model invocation.
Another mistake is demos that do not force state transitions. If metrics stay flat, defects can hide in integration paths.
Production AI System Design Relevance
This lesson acts as the governance layer of an AI system. It protects model-serving capacity, reduces tenant contention, and keeps economics visible to platform teams.
In the broader architecture, it belongs near API ingress, gateway middleware, or request orchestration boundaries.
Workflow
Explain:
request flow
execution flow
data flow
state changes
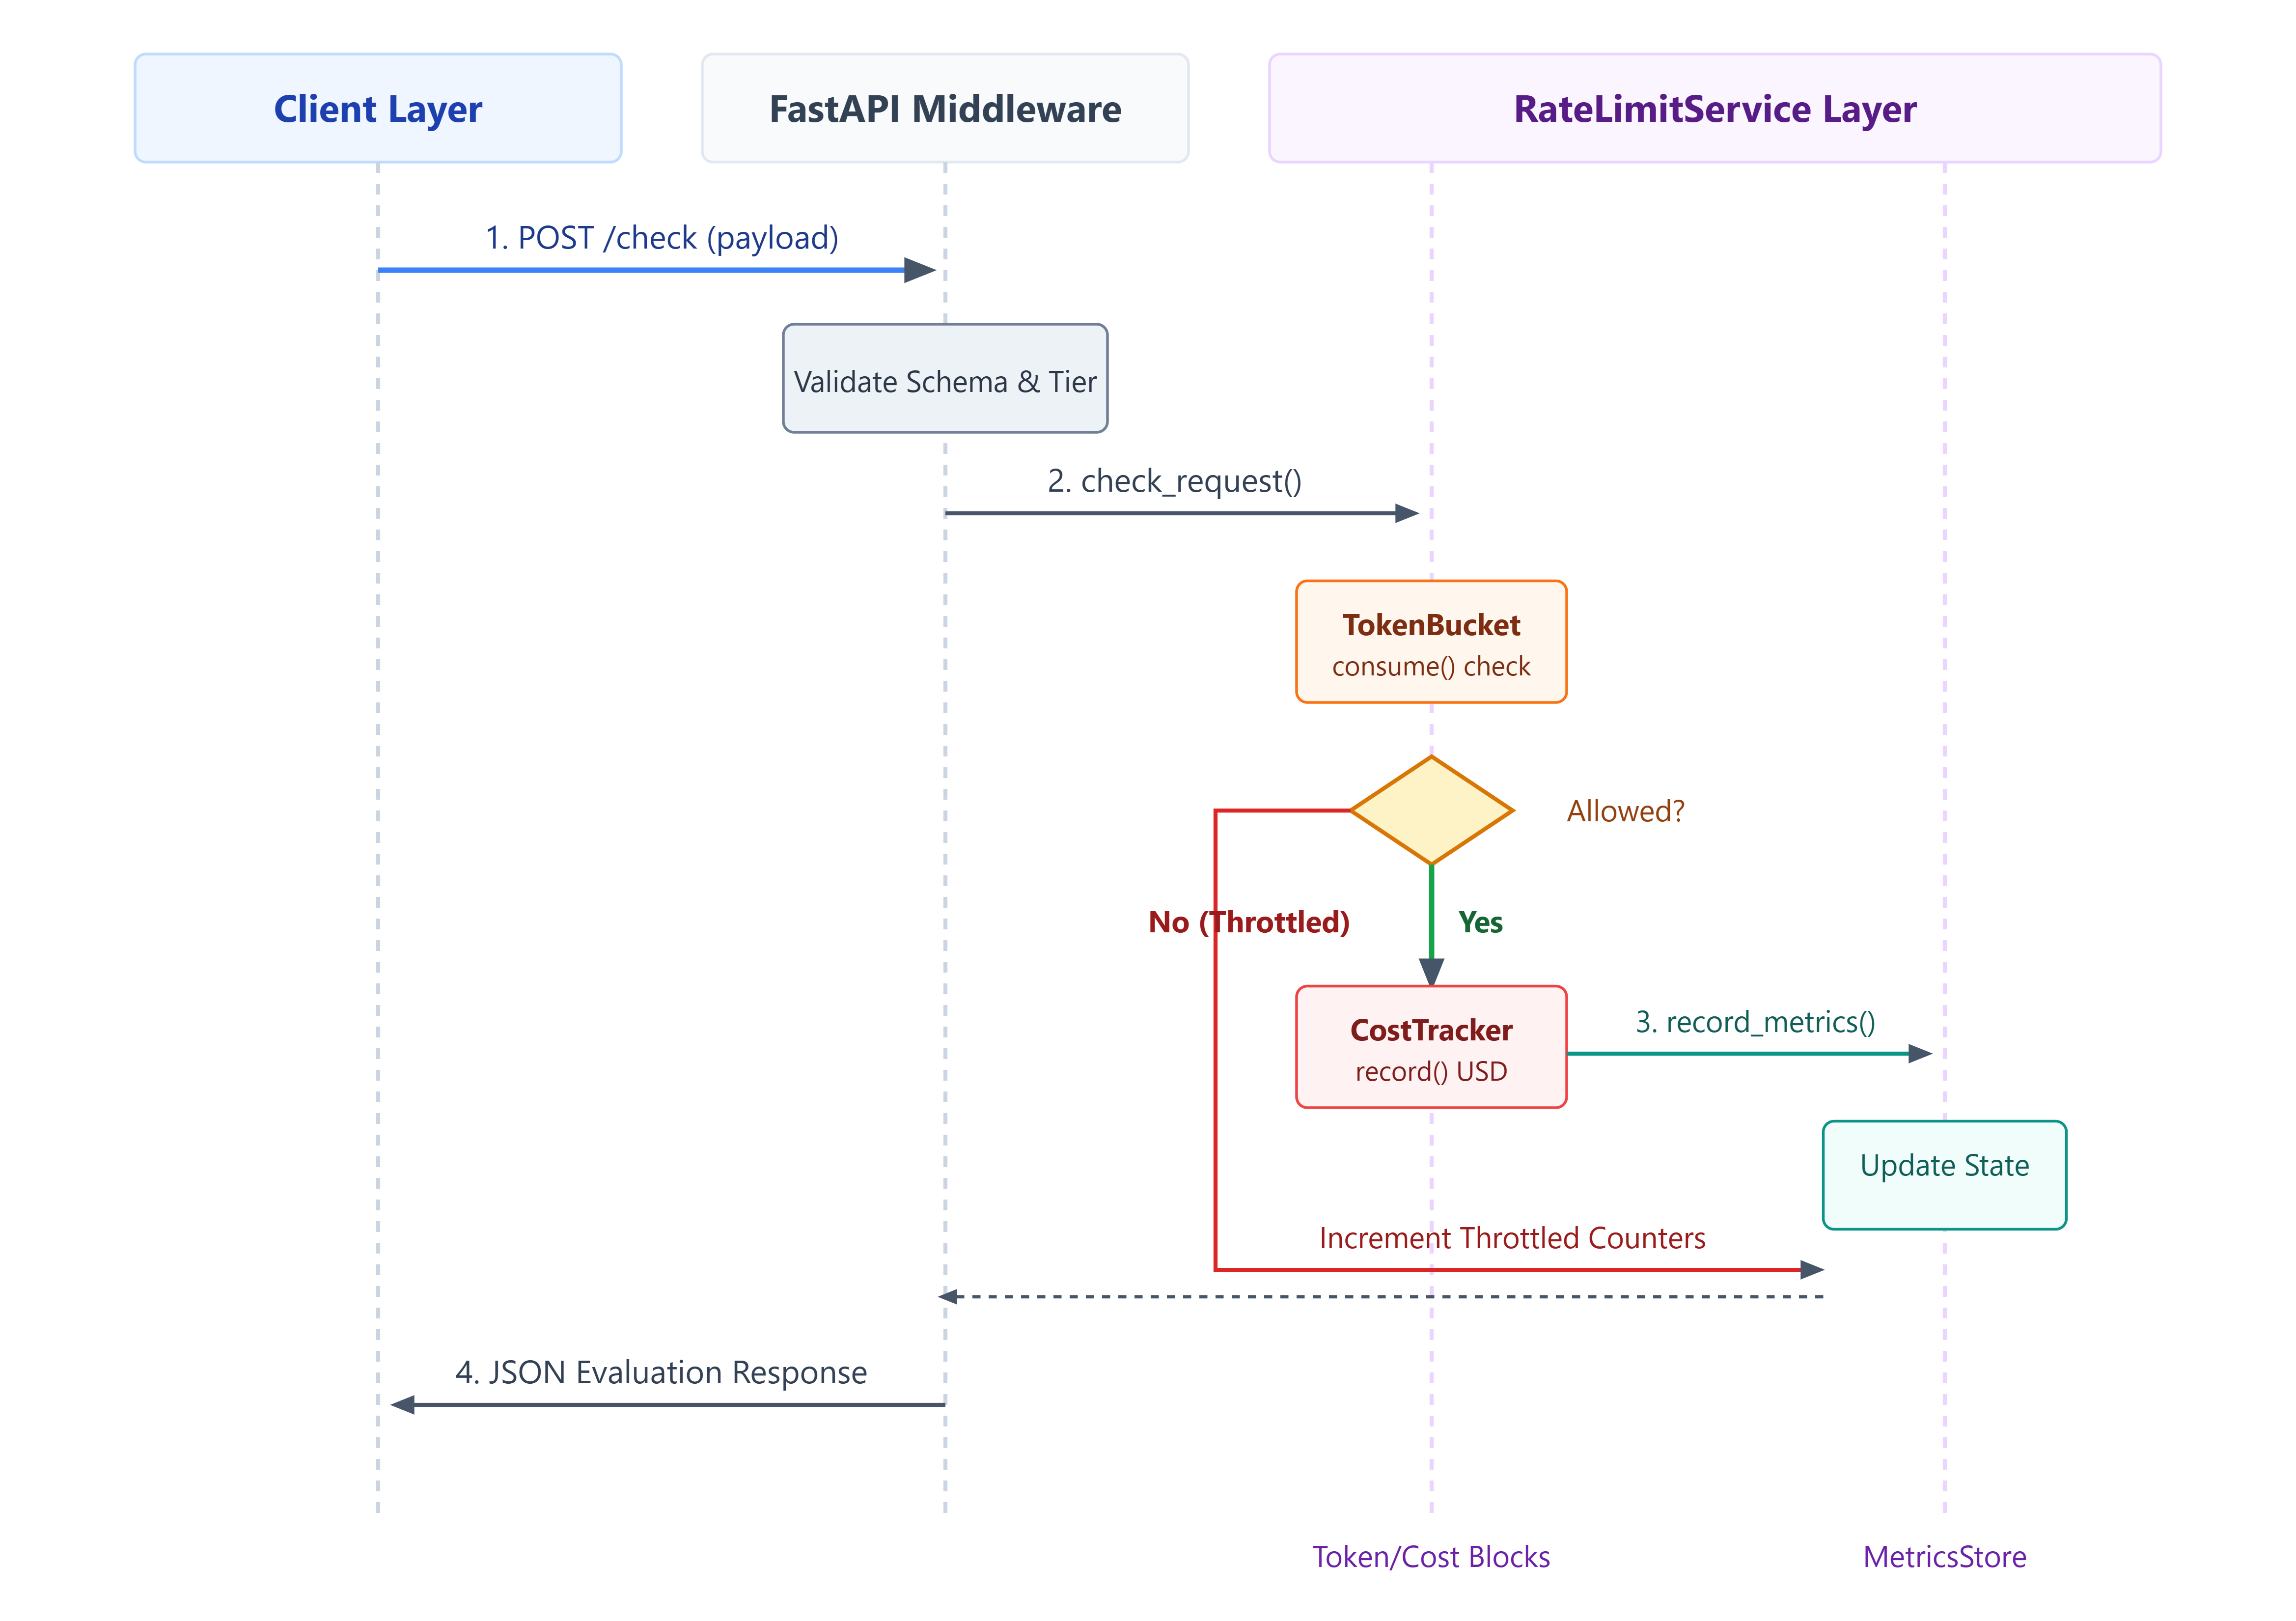
Request flow: client submits user, tier, and token metadata.
Execution flow: service checks tokens, records spend for allowed requests, updates metrics/events, returns policy decision.
Data flow: validated payload enters service, state mutates in-memory, dashboard fetches snapshots via /metrics.
State changes: bucket tokens deplete/refill, spend accumulates, remaining budget drops, alert counters increment.
Production Integration
Explain:
production architecture fit
enterprise deployment patterns
scalability
observability
security considerations
Architecture fit: reusable middleware or embedded policy module in API workers.
Enterprise pattern: central tier/budget policy config per tenant or environment.
Scalability: externalize counters and budgets to Redis or durable stores for multi-replica consistency.
Observability: export metrics/events to Prometheus or OpenTelemetry and alert on burn-rate and throttle spikes.
Security: strict schema validation, bounded token values, and controlled admin policy updates.
Important Classes
TokenBucketRateLimiterCostTrackerMetricsStoreRateLimitService
Key Methods
TokenBucket.consume()RateLimiter.check()CostTracker.record()MetricsStore.record()RateLimitService.check_request()RateLimitService.run_demo()
Step-by-Step Implementation
GitHub Link:
https://github.com/sysdr/production-ai-engineering/tree/main/lesson4/aiam-day04
First, implement throttling primitives with deterministic behavior (TokenBucket, RateLimiter). This isolates rate math and makes tests precise.
Next, add CostTracker to convert token usage into spend at request time. This creates immediate economics visibility.
Then, centralize observability with MetricsStore. One write path prevents metric drift and simplifies debugging.
After that, compose all controls in RateLimitService, which executes the canonical transaction: throttle, account, emit metrics, return decision.
Expose FastAPI endpoints with explicit schema constraints for tier and token bounds. Validation prevents malformed policy inputs from corrupting state.
Add deterministic demo operations that guarantee non-zero metric movement. This is critical for dashboard checks and CI smoke tests.
Finally, wire scripts and Docker so runtime is fully independent and operational without external scaffolding.
Coding Highlights
Service-layer orchestration keeps endpoint handlers thin and testable. Policy maps avoid hard-coded branches, and event emission adds incident context beyond raw counters.
Working Demo Link:
Production Considerations
Scalability: move shared state to distributed storage
Security: lock down policy mutation and validate all inputs
Monitoring: alert on throttle ratio, burn rate, and latency drift
Logging: structured decision logs for audit and triage
Testing: unit + API + script-level smoke coverage
Failure handling: safe degradation when telemetry dependencies fail
Edge cases: refill timing drift, burst storms, mis-tiered traffic
Validation
Verification uses burst-limit tests, refill timing assertions, and cost-math checks. Success means healthy endpoints, deterministic throttling, accurate spend, and non-zero metrics after demo. Expected outputs are rising counters, populated events, latency values, and budget alerts under stress. Production checklist: self-contained child scripts and reproducible startup/cleanup.
Real-World Examples
Enterprise support copilot: premium tenants get higher refill rates, while budget alerts prevent monthly overrun.
Internal developer assistant: build bots are rate-limited and token-accounted to protect shared model capacity.