[A] Today’s Build
We’re building a Model Comparison & Benchmarking Platform that:
Profiles multiple LLM models across performance dimensions (latency, throughput, cost, quality)
Executes real-time benchmarks with identical prompts across model variants
Calculates cost-performance ratios integrating L4’s pricing analysis with live inference metrics
Visualizes selection trade-offs through interactive dashboards showing the Pareto frontier of model choices
Generates deployment recommendations based on workload characteristics and budget constraints
Building on L4: We leverage the parameter counting, token analysis, and cost calculation utilities to add dynamic performance measurement. L4 gave us static model specifications; L5 adds runtime behavior profiling.
Enabling L6: Our benchmark framework establishes the API interaction patterns, error handling, and response parsing that L6 will secure with authentication, rate limiting, and credential management.
[B] Architecture Context
In the 90-lesson VAIA journey, L5 sits at the critical decision point where theoretical understanding transforms into strategic deployment choices. Module 1 (Fundamentals) builds from understanding what agents are (L1-L3) to understanding what powers them (L4-L6).
Integration with L4: We import the CostCalculator and ParameterAnalyzer classes to enrich benchmark results with cost projections and parameter-efficiency metrics. The token counting logic from L4 ensures accurate cost attribution per inference.
Module Objectives Alignment: This lesson completes the LLM foundation trilogy:
L4: Static analysis (what models promise)
L5: Dynamic analysis (what models deliver)
L6: Secure integration (how to access models safely)
[C] Core Concepts
The 2025 Model Landscape
Frontier Models (GPT-5, Gemini 2.0 Ultra, Claude 3.7 Opus): High capability, high cost, ideal for complex reasoning, creative generation, and tasks requiring nuanced understanding. Context windows now exceed 1M tokens, enabling entire codebases or long documents as input.
Efficient Models (Gemini 2.0 Flash, Claude 3.7 Sonnet, GPT-5 Mini): Balanced performance-cost, 10-50x faster inference, suitable for 80% of production workloads. Context windows typically 128K-256K tokens.
Small Language Models (Phi-4, Llama 3.1 8B, Gemini Nano): On-device deployment, <10B parameters, millisecond latency, privacy-preserving. Critical for edge computing and high-throughput scenarios.
Selection Framework
The Triple Constraint: Every model selection involves trade-offs between:
Quality: Task completion accuracy, reasoning depth, output coherence
Speed: Time-to-first-token (TTFT), tokens-per-second (TPS), end-to-end latency
Cost: Per-token pricing, infrastructure overhead, scaling economics
Key Insight: Most production VAIAs use model cascading—routing simple queries to efficient models and complex ones to frontier models. Our benchmark platform reveals the routing thresholds.
VAIA System Design Relevance
In enterprise VAIAs, model selection isn’t monolithic. Different agent components need different models:
Intent Classification: SLMs (Phi-4) for sub-50ms latency
Entity Extraction: Efficient models (Gemini Flash) for balanced speed-accuracy
Complex Reasoning: Frontier models (Gemini Ultra) for critical decisions
Content Generation: Model choice depends on quality requirements and volume
Workflow & State Changes
[User Request] → [Benchmark Orchestrator]
                        ↓
              [Load Test Prompts]
                        ↓
        [Parallel Model Invocations]
                        ↓
   ┌────────────┬────────────┬─────────────┐
   ↓            ↓            ↓             ↓
[Gemini Flash] [Gemini Pro] [Gemini Ultra] [Analysis]
   ↓            ↓            ↓             ↓
        [Collect Metrics: Latency, Cost, Quality]
                        ↓
              [Aggregate Results]
                        ↓
        [Generate Recommendations]
                        ↓
          [Dashboard Visualization]
State Transitions:

IDLE → BENCHMARKING (on test initiation)
BENCHMARKING → ANALYZING (after all models respond)
ANALYZING → COMPLETE (results ready)
Error states: MODEL_TIMEOUT, API_ERROR, QUOTA_EXCEEDED
[D] VAIA Integration
Production Architecture Fit
Modern VAIAs implement adaptive model routing:
python# Pseudocode for intelligent routing
if task.complexity < 0.3:
    model = “phi-4”  # SLM, 2ms latency, $0.0001/1K tokens
elif task.complexity < 0.7:
    model = “gemini-flash”  # 50ms, $0.0005/1K tokens
else:
    model = “gemini-ultra”  # 200ms, $0.005/1K tokens
Our benchmark platform quantifies the complexity thresholds by measuring where quality degradation becomes unacceptable.
Enterprise Deployment Patterns
Pattern 1: Cost-Conscious Cascading
Netflix-style approach: Start with cheapest model, escalate only on uncertainty signals (low confidence scores, detected ambiguity).
Pattern 2: Latency-Optimized Parallel
Uber-style: Query multiple models simultaneously, return fastest acceptable response. Increases cost but guarantees p99 latency SLAs.
Pattern 3: Hybrid Edge-Cloud
On-device SLMs handle common cases (80% of traffic), cloud models for edge cases. Reduces cloud costs by 75% while maintaining quality.
Real-World Examples
Stripe’s Fraud Detection VAIA: Uses Phi-4 for initial scoring (sub-10ms), escalates 5% of transactions to Gemini Ultra for complex pattern analysis.
OpenAI’s Customer Support Agents: Routes 70% of queries to GPT-5 Mini, 25% to GPT-5, 5% to human experts based on confidence thresholds learned from benchmark data.
[E] Implementation
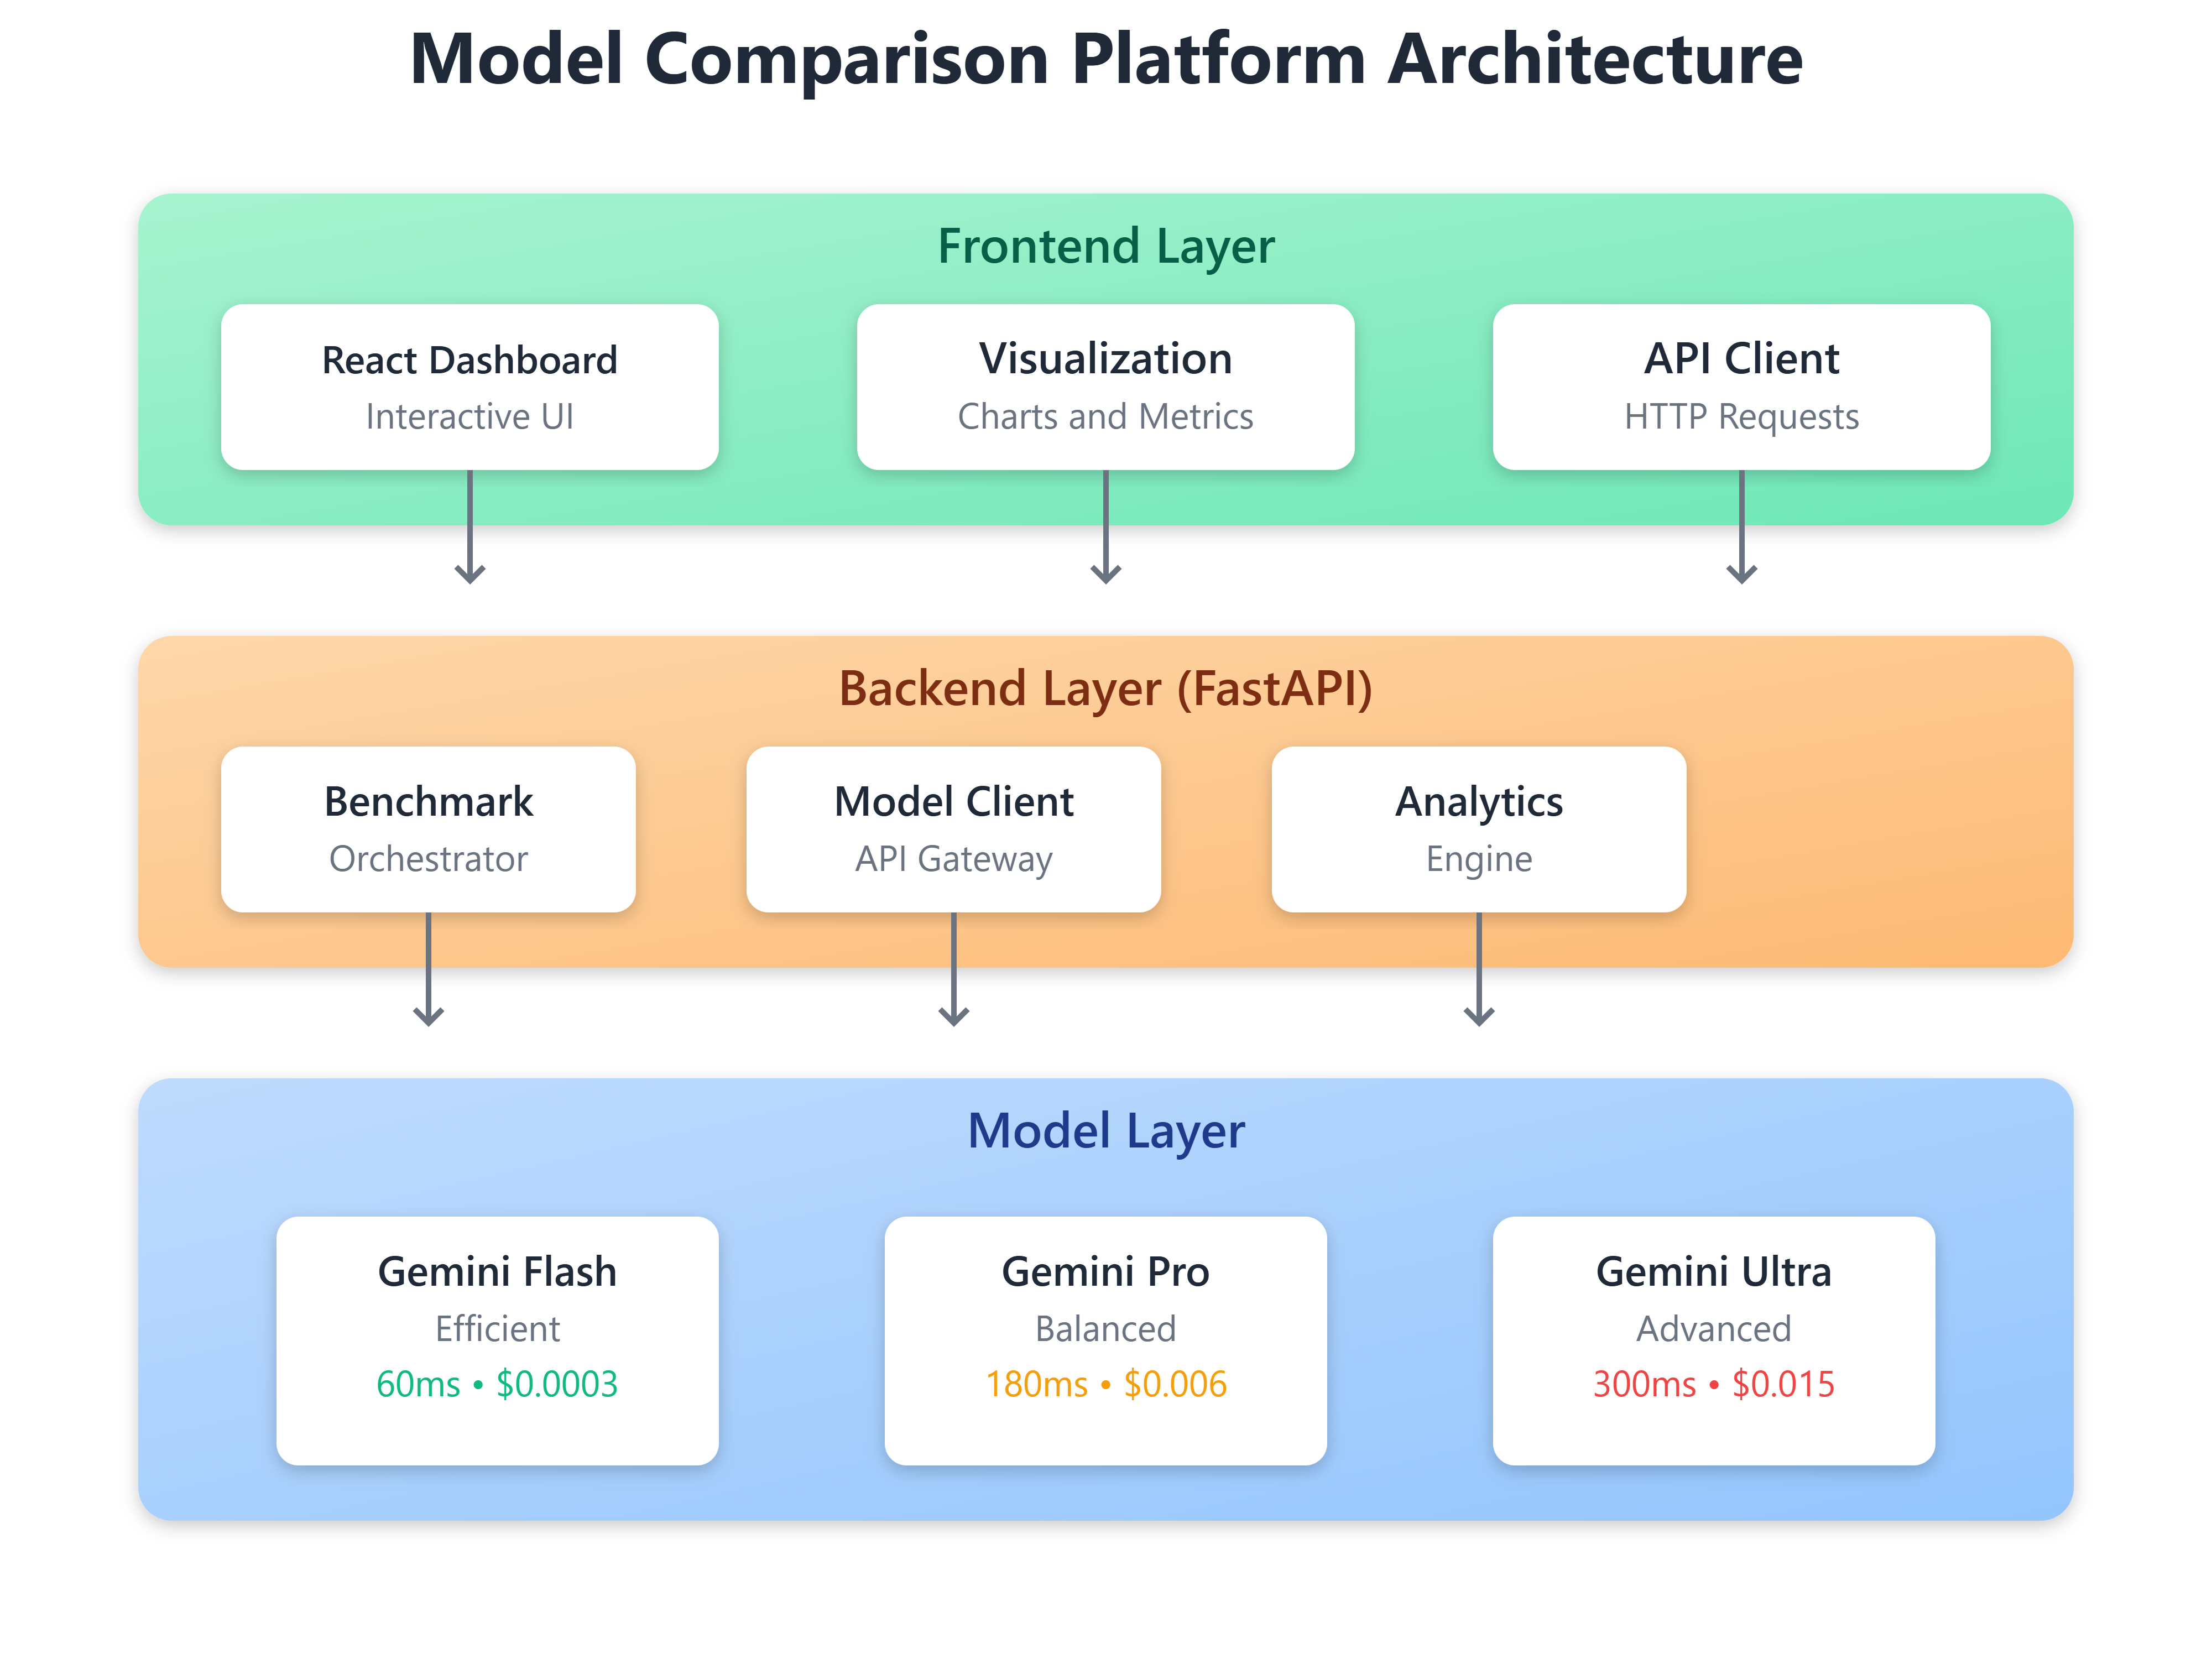
Component Architecture
Core Components:
BenchmarkOrchestrator: Manages test execution across models
ModelClient: Abstracts API interactions per provider
MetricsCollector: Captures latency, token counts, costs
AnalyticsEngine: Computes cost-performance ratios, quality scores
ComparisonDashboard: React UI for interactive visualization
Architecture Diagram: