
Highlights
What We Build
A MASTraceLogger that captures every inter-agent message with causal parent IDs, timing, and token costs—structured as an append-only SQLite log with WAL mode.
An AgentProfiler that instruments async coroutines without blocking the hot path, measuring wall time, LLM call latency, and tool invocation costs per agent per turn.
An InteractionGraph that reconstructs directed causal trees from raw trace logs, enabling root-cause attribution of failures and latency outliers.
A TraceReplayEngine that re-executes frozen trace segments against a deterministic stub to validate behavioral correctness without burning live API quota.
A React debug dashboard with real-time trace streaming, flame-graph-style latency bars, and graph-based message-flow visualization.
Connection to L58
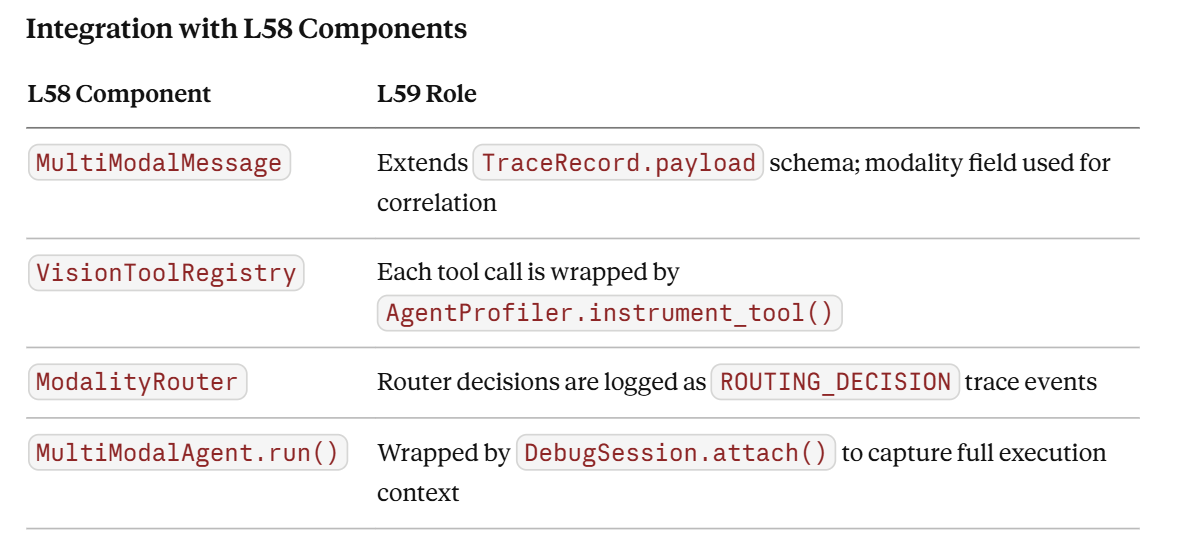
L58 introduced MultiModalAgent, VisionToolRegistry, and MultiModalMessage—a richer, higher-dimensionality message type that adds vision payloads to the standard text envelope. Multi-modal messages are significantly harder to debug than text-only exchanges because failures can originate in the vision encoder, the routing logic, or the LLM’s cross-modal reasoning. L59’s MASTraceLogger ingests MultiModalMessage natively, attaching modality metadata (text, image, audio) to every trace record so the InteractionGraph can surface modality-correlated failure patterns.
Enables L60
L60 (Project 4: Collaborative Agent Team) requires a fully orchestrated MAS solving a decomposed business task. The EvaluationHarness and MASTraceLogger built here become the observability backbone of that system—L60 will emit traces using the exact TraceRecord schema introduced in L59, and the assignment rubric for L60 will be graded using EvaluationHarness.score().
Architecture Context
Place in the 90-Lesson Path
L59 sits at the hinge between single-agent construction (L1–L57) and team-level agent engineering (L60–L70). Every prior lesson built individual capabilities—tool use, memory, RAG, multi-modality. From L60 onward, the curriculum assumes that multi-agent systems can be observed, measured, and debugged with the same rigor applied to microservices. L59 installs that assumption.
Integration with L58 Components
Module Objectives Alignment
Module 5 (Enterprise MLOps) demands that every system shipped has instrumented observability. L59 delivers on three of the module’s five objectives: structured logging, performance profiling, and evaluation framework design.
Core Concepts
Why MAS Debugging Is a Different Problem
In a single-agent system, debugging is sequential: step through the LLM call, inspect the tool result, check the response. In a multi-agent system (MAS), agents execute concurrently, messages cascade through layers, and a single user request might fork into a dozen parallel sub-tasks before reconverging. The debugging surface explodes combinatorially.
Three failure modes dominate production MAS incidents:
Causal amnesia — an agent produces a wrong output but its local logs look clean. The error originated upstream, three hops earlier, and propagated silently through intermediate agents who accepted it without validation.
Latency stacking — individual agent turns are fast, but end-to-end latency is 4× higher than expected. No single agent is slow; the bottleneck is a serialization dependency that should have been parallelizable.
Emergent disagreement — two agents with different subsets of context reach contradictory conclusions that are never reconciled, producing a compound output that is internally inconsistent.
None of these failures is detectable by inspecting individual agents in isolation. They require system-level observability.
Causal Tracing vs. Simple Logging
Simple logging records what happened. Causal tracing records why it happened and what caused what. The key mechanism is a trace correlation ID (a UUID assigned to the root user request) and a causal parent ID (the ID of the trace record that triggered the current agent turn). Together they form a directed acyclic graph (DAG) over the execution.
TraceRecord:
  trace_id:    UUID4          # root request
  span_id:     UUID4          # this turn
  parent_id:   UUID4 | None   # triggering event
  agent_name:  str
  event_type:  Literal["SEND", "RECEIVE", "LLM_CALL", "TOOL_CALL", "ROUTING_DECISION", "ERROR"]
  timestamp:   float          # monotonic ns
  duration_ns: int
  payload:     dict           # message content, truncated
  token_cost:  TokenCost      # prompt + completion tokens
  modality:    str            # "text" | "image" | "audio" | "multimodal"
The parent_id → span_id chain is sufficient to reconstruct the full causal tree using a single recursive query. This is the same model used by OpenTelemetry, but adapted for agent-specific semantics (LLM calls, tool invocations, routing decisions).
Async Profiling Without Blocking
Standard Python profilers (cProfile) are not concurrency-aware: they profile the thread, not the coroutine. In an async MAS built on asyncio, a single thread may interleave dozens of coroutines. cProfile aggregates their wall time incorrectly.
The correct approach is coroutine-level instrumentation using asyncio‘s event loop hooks:
import time
from functools import wraps

def profile_async(agent_name: str):
    def decorator(fn):
        @wraps(fn)
        async def wrapper(*args, **kwargs):
            start = time.monotonic_ns()
            try:
                result = await fn(*args, **kwargs)
                return result
            finally:
                elapsed = time.monotonic_ns() - start
                AgentProfiler.record(agent_name, fn.__name__, elapsed)
        return wrapper
    return decorator
This decorator adds ~200ns overhead per call—negligible for LLM-bound agents—and is safe for concurrent execution because Python integers are GIL-protected.
Evaluation Harness Design
An evaluation harness for a MAS needs to answer three questions for each test case:
Correctness: Did the final output match the expected output (or pass a semantic similarity threshold)?
Efficiency: Did the system stay within token and latency budgets?
Structural compliance: Did the agent interaction graph match the expected topology? (e.g., did the orchestrator agent always send to the researcher before the writer?)
The harness compares expected_trace_topology (a DAG template) against the actual InteractionGraph, using subgraph isomorphism to detect deviations. This catches entire categories of bugs—like an orchestrator that skips a validation step under load—that pure output comparison misses entirely.
The TraceReplayEngine
Re-running a failed trace is expensive if it requires live LLM calls. The TraceReplayEngine solves this by extracting the LLM responses from the original trace log and replaying them as deterministic stubs, short-circuiting actual API calls. This enables:
Regression testing: verify a bug fix doesn’t re-introduce old failure traces.
Counterfactual analysis: inject a modified message at hop N and observe downstream effects.
Cost-free CI: run the full MAS test suite in CI without any API spend.
Integration
Production Architecture Fit
The trace logging pipeline is decoupled from the agent execution pipeline via an async queue. Agents emit TraceRecord objects into asyncio.Queue; a dedicated writer coroutine drains the queue to SQLite. This ensures that a slow disk write never blocks an LLM call.
[Agent] ──emit──> [asyncio.Queue] ──drain──> [SQLite WAL]
                                         └──> [WebSocket broadcast]
The WebSocket broadcast enables the React dashboard to receive real-time trace events with sub-100ms latency.
Enterprise Deployment Patterns
In production, replace SQLite with a time-series store (ClickHouse, TimescaleDB) and the WebSocket broadcaster with a Kafka consumer. The TraceRecord schema is designed to be serializable to both JSON (for Kafka) and binary MessagePack (for high-throughput ingestion). The EvaluationHarness is designed to run as a GitHub Actions job in CI, consuming trace archives from object storage.
Implementation
GitHub Link
https://github.com/sysdr/vertical-ai-agents/tree/main/lesson59/l59-mas-eval
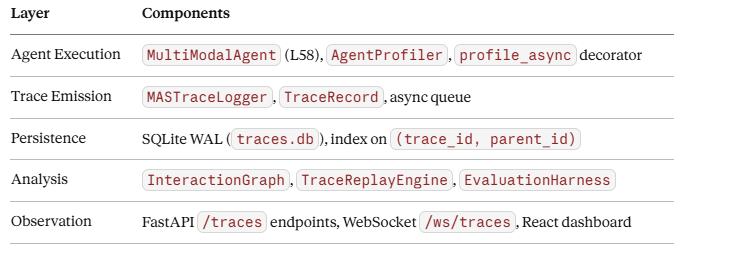
Component Architecture
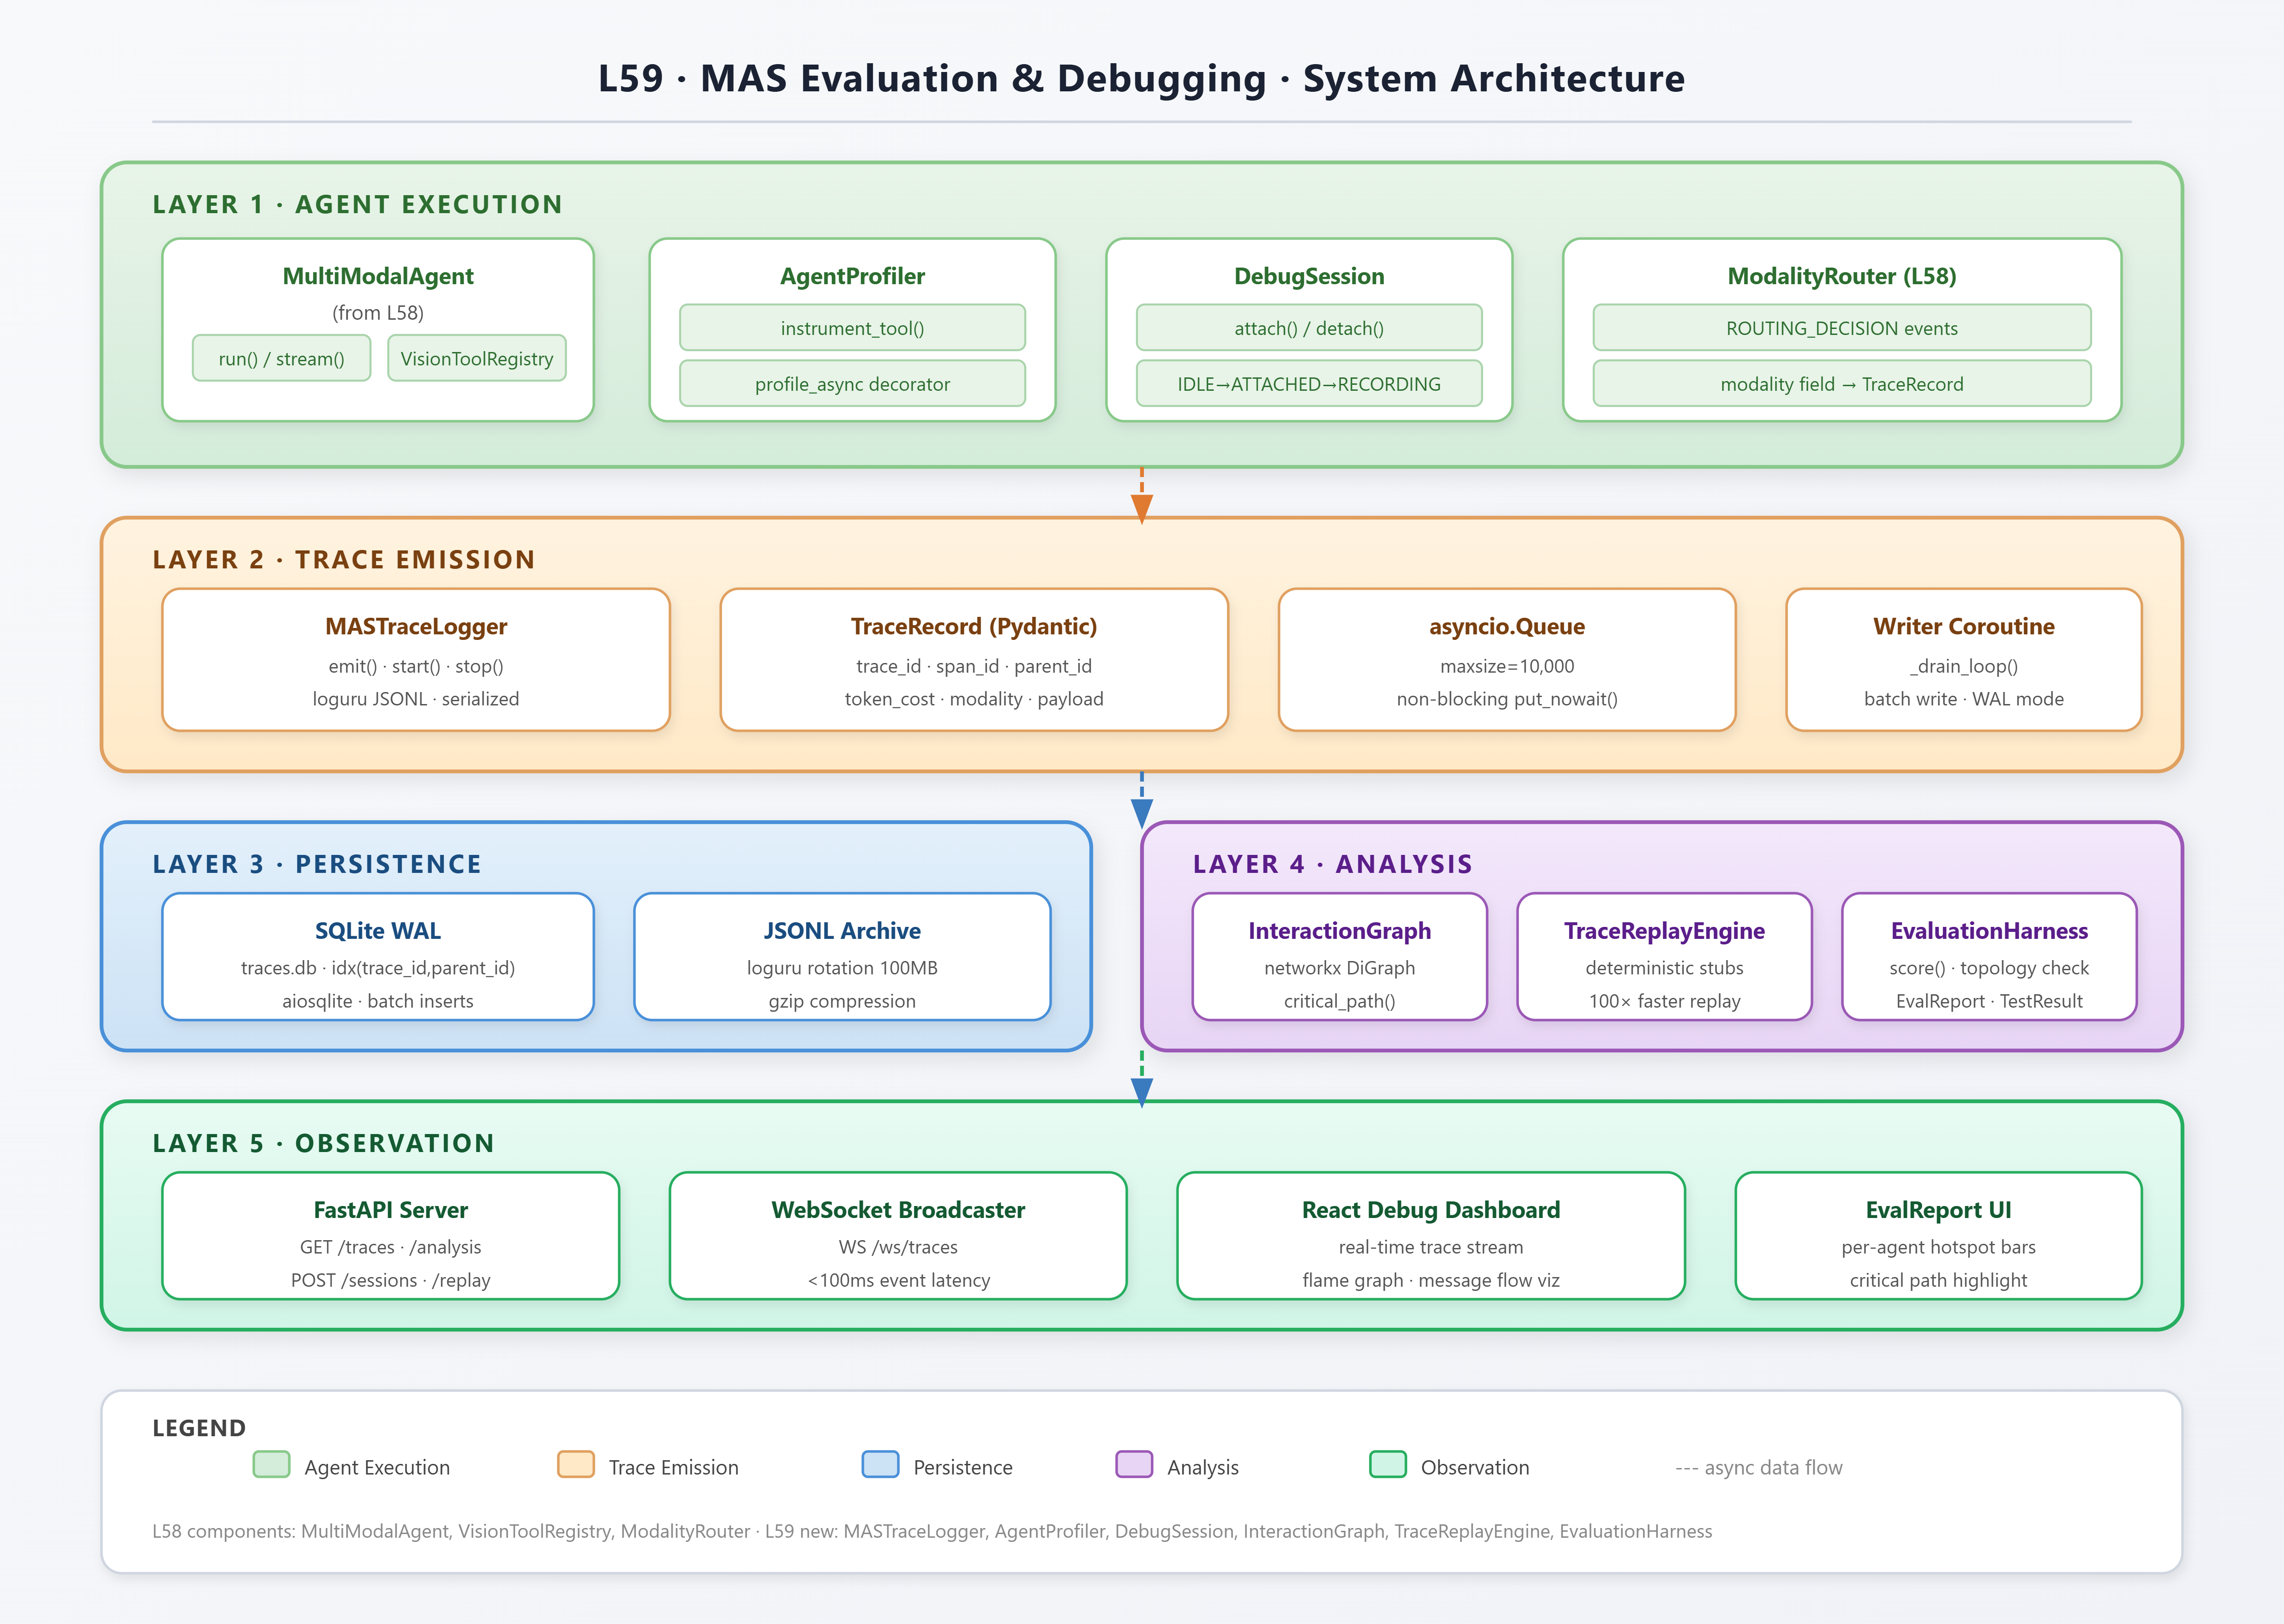
The system has five layers:
Control and Data Flows
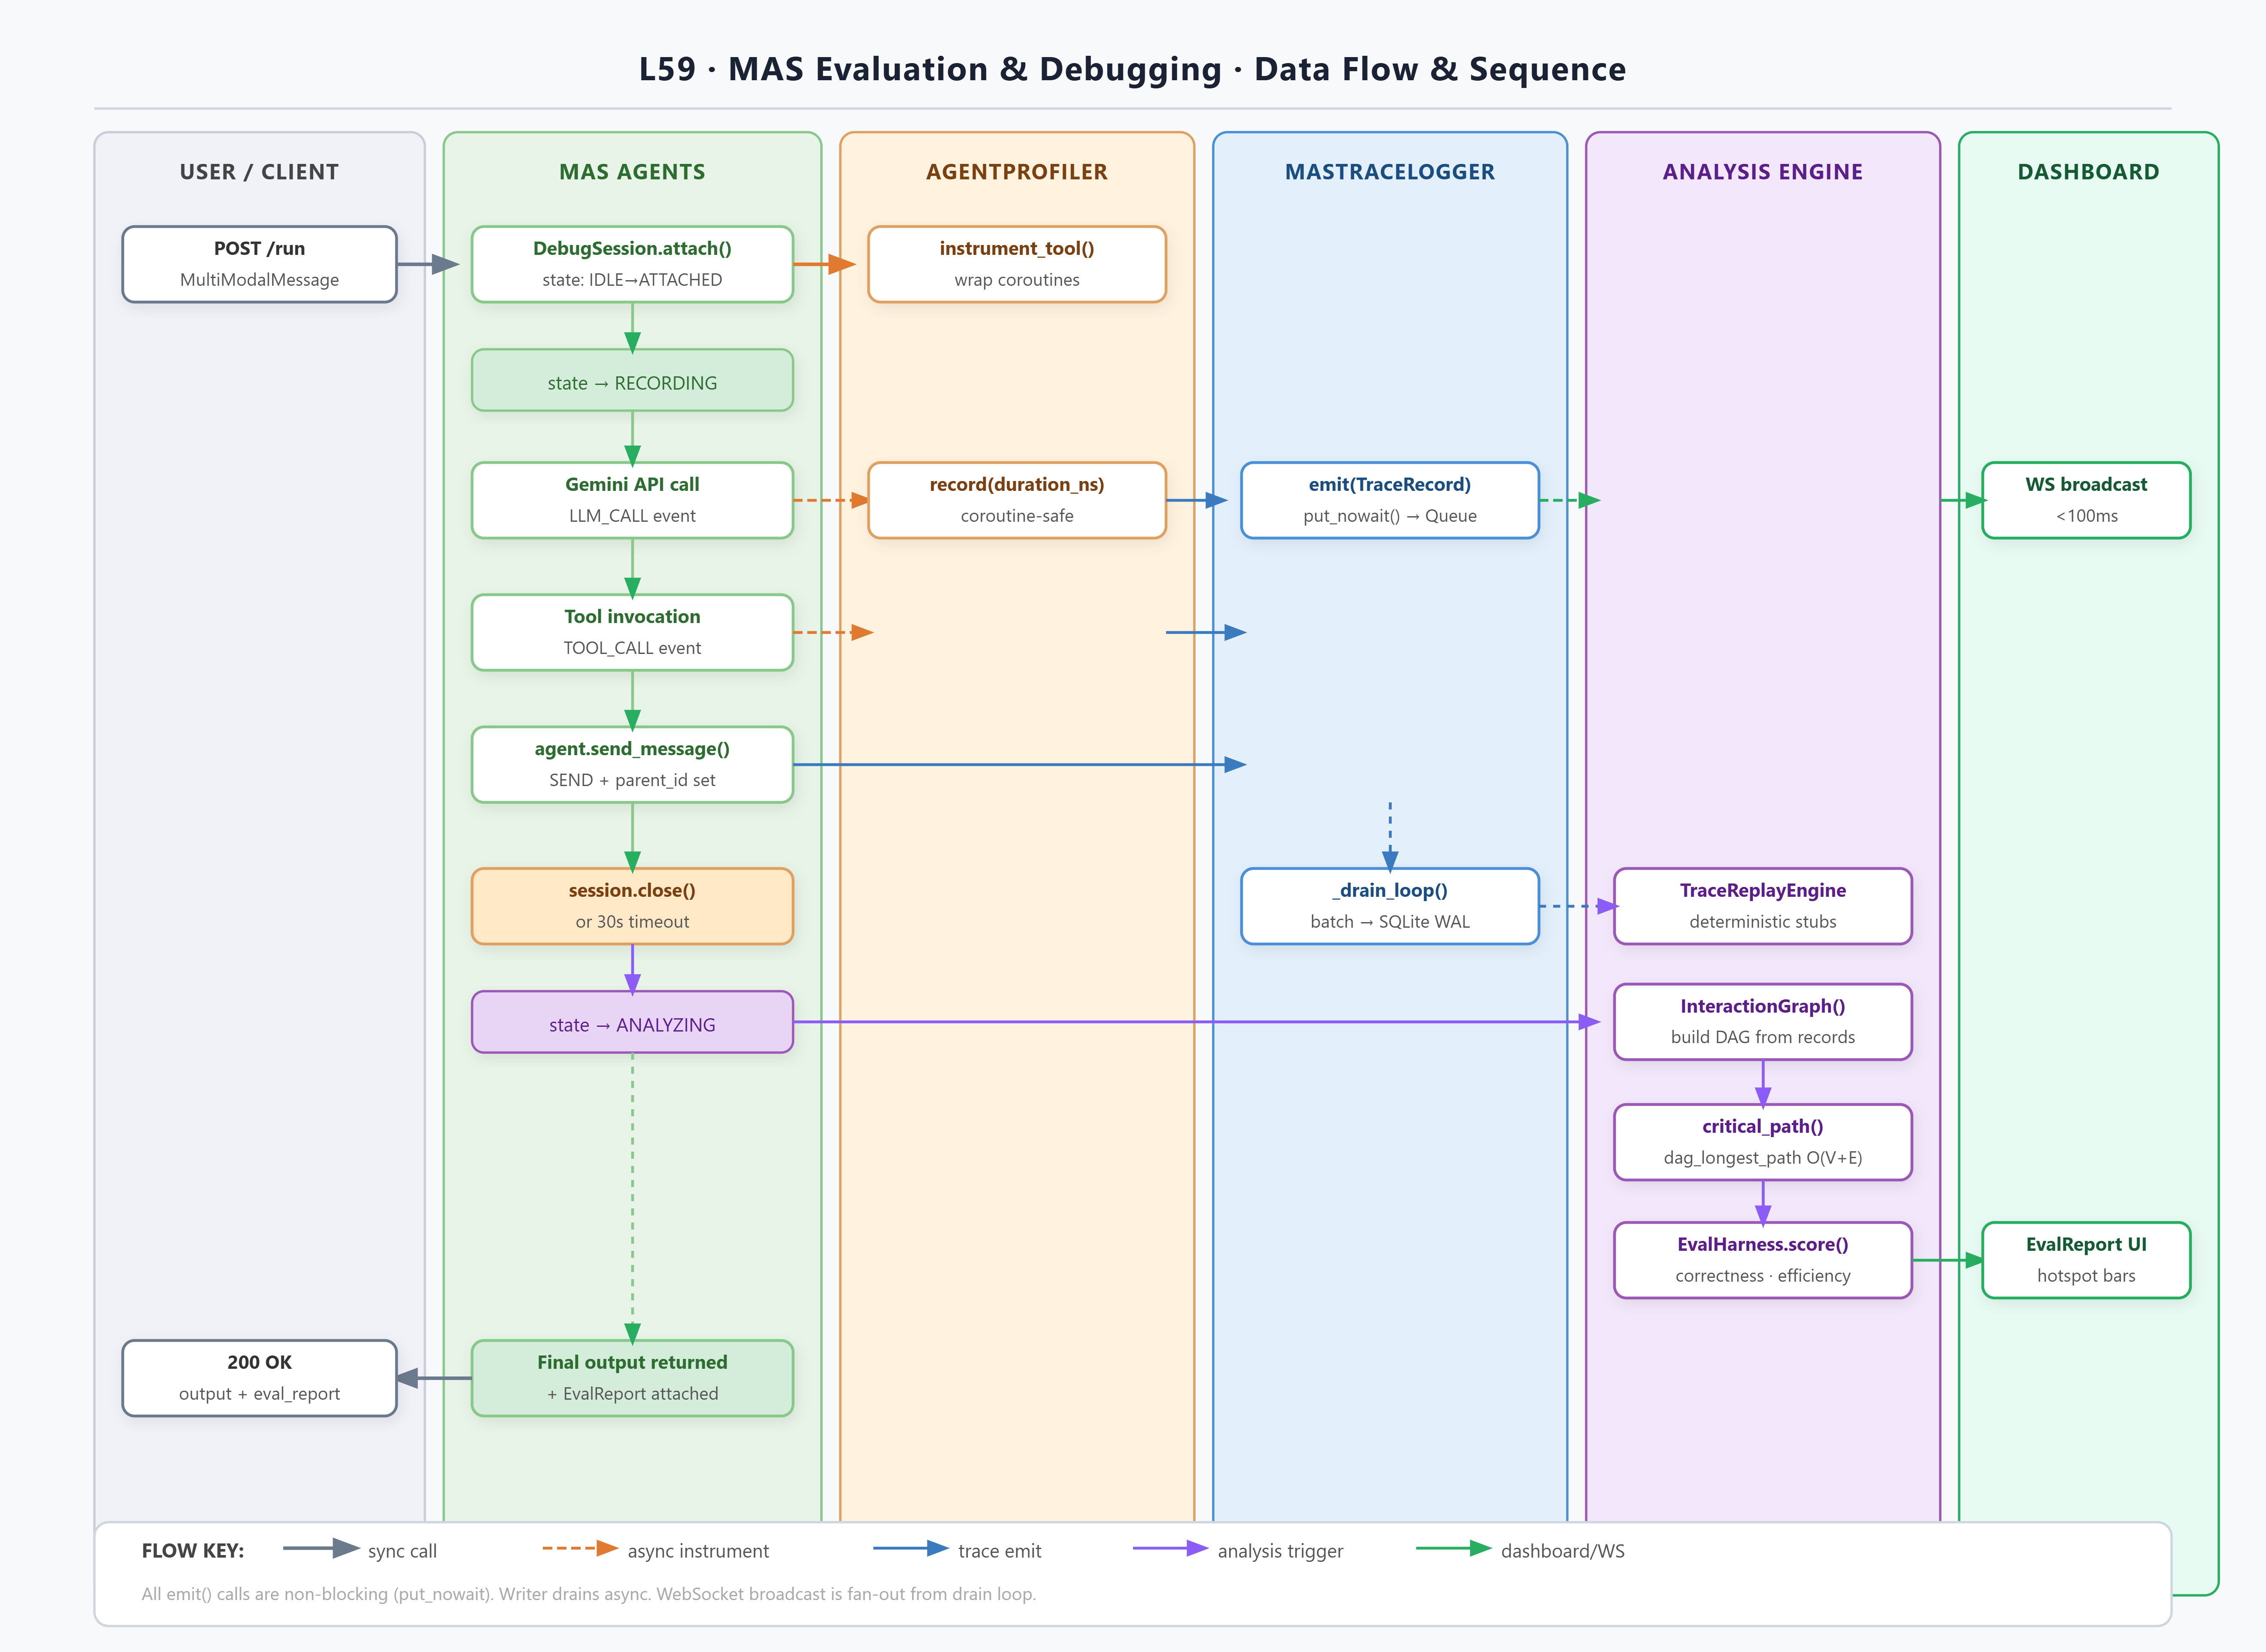
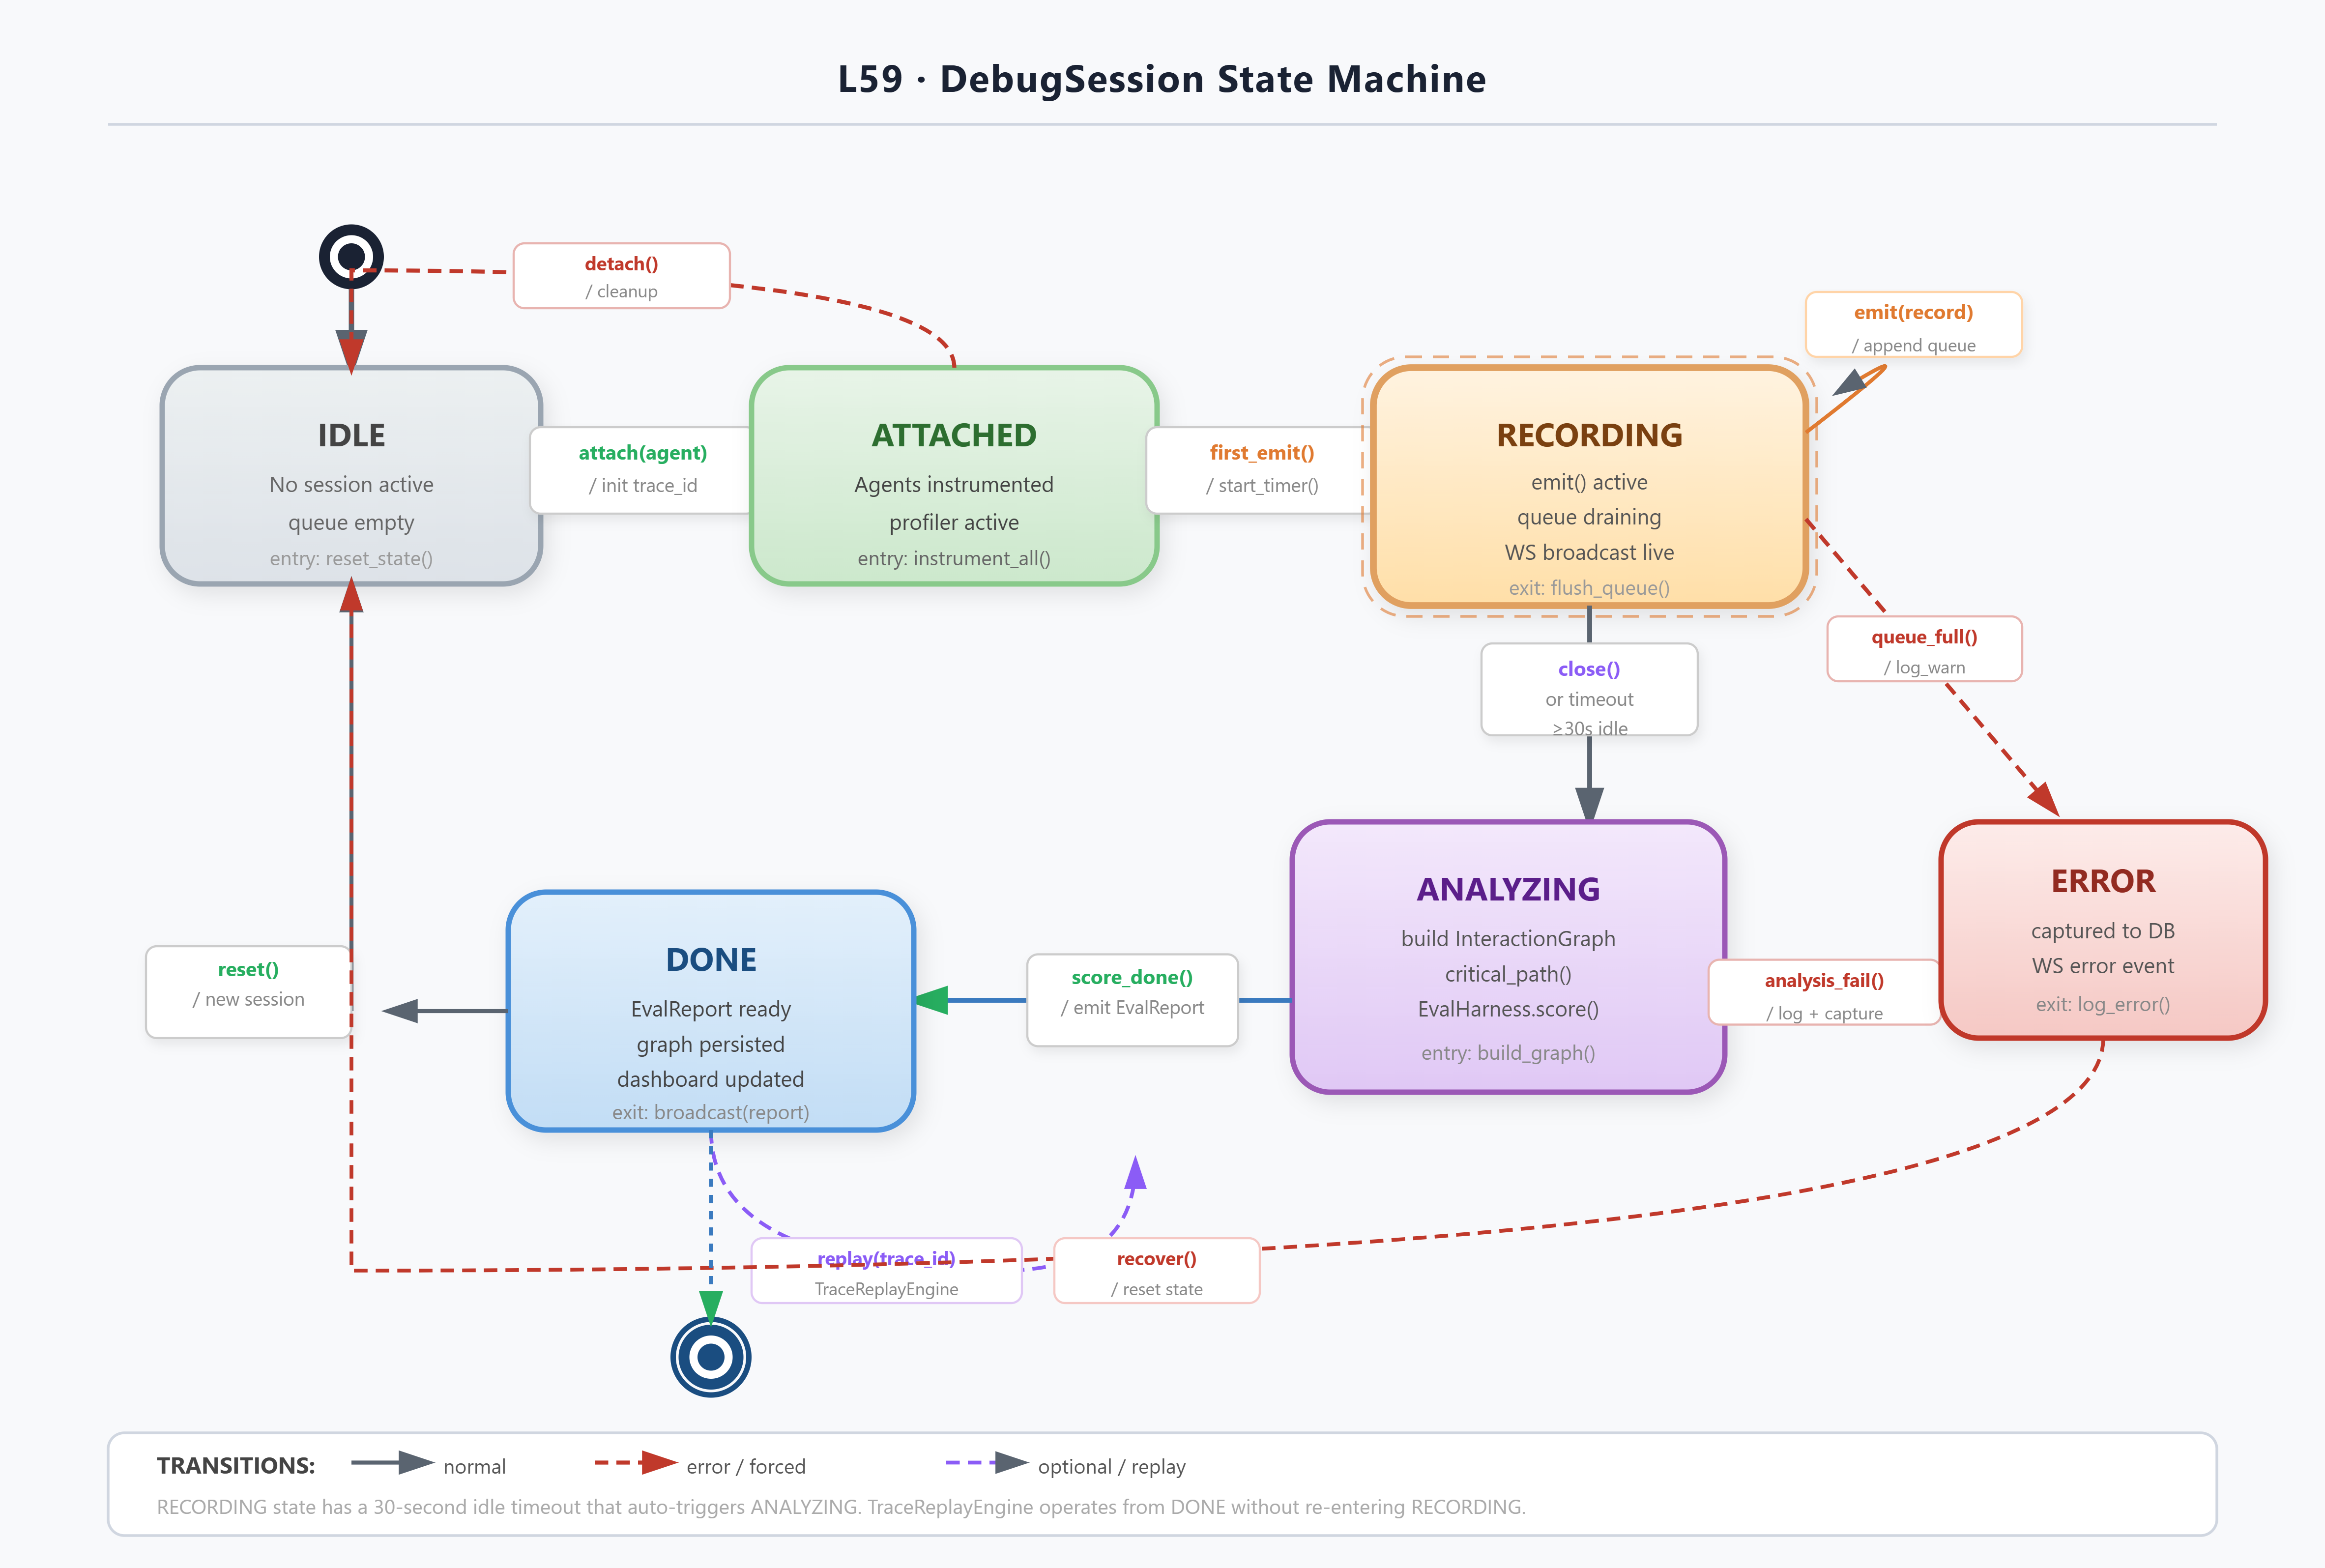
State Machine
The DebugSession manages four states: IDLE → ATTACHED → RECORDING → ANALYZING. The transition from RECORDING to ANALYZING is triggered either by explicit session close or by a configurable timeout (default 30s after last event). In ANALYZING state, the InteractionGraph is built and the EvaluationHarness runs all registered test cases.
Coding Highlights
Structured Trace Emission
from loguru import logger
import structlog

# Configure loguru for structured JSON output
logger.add(
    "logs/mas_traces_{time}.jsonl",
    format="{message}",
    serialize=True,
    rotation="100 MB",
    compression="gz",
    level="DEBUG",
    filter=lambda r: "trace_id" in r["extra"]
)

class MASTraceLogger:
    def __init__(self, db_path: str = "traces.db"):
        self._queue: asyncio.Queue[TraceRecord] = asyncio.Queue(maxsize=10_000)
        self._db_path = db_path
        self._writer_task: asyncio.Task | None = None

    async def start(self):
        await self._init_db()
        self._writer_task = asyncio.create_task(self._drain_loop())

    async def emit(self, record: TraceRecord) -> None:
        # Non-blocking: drop if queue full, log warning
        try:
            self._queue.put_nowait(record)
        except asyncio.QueueFull:
            logger.warning("Trace queue full — dropping record", span_id=record.span_id)
Key production decisions:
maxsize=10_000caps memory at ~10 MB for typical trace payloads; overflow is dropped with a warning rather than blocking.serialize=Trueon loguru emits JSONL, which is parseable by any log aggregator without schema knowledge.The writer runs in its own task, isolated from agent coroutines.
InteractionGraph Construction
import networkx as nx
from collections import defaultdict

class InteractionGraph:
    def __init__(self, records: list[TraceRecord]):
        self.G = nx.DiGraph()
        self._build(records)

    def _build(self, records: list[TraceRecord]):
        # Group by span_id for O(1) lookup
        span_map = {r.span_id: r for r in records}
        for r in records:
            self.G.add_node(r.span_id, **r.model_dump(exclude={"payload"}))
            if r.parent_id and r.parent_id in span_map:
                self.G.add_edge(r.parent_id, r.span_id, weight=r.duration_ns)

    def critical_path(self) -> list[str]:
        """Longest path by duration — the actual latency bottleneck."""
        return nx.dag_longest_path(self.G, weight="weight")

    def agent_hotspots(self) -> dict[str, int]:
        """Total duration per agent across all spans."""
        totals: dict[str, int] = defaultdict(int)
        for _, data in self.G.nodes(data=True):
            totals[data["agent_name"]] += data.get("duration_ns", 0)
        return dict(sorted(totals.items(), key=lambda x: -x[1]))
nx.dag_longest_path is O(V+E) — fast enough for traces with hundreds of spans. The critical path directly names the bottleneck agent.
EvaluationHarness Scoring
@dataclass
class TestCase:
    name: str
    expected_output_pattern: str       # regex or semantic threshold
    max_tokens: int = 50_000
    max_latency_ms: int = 30_000
    expected_topology: nx.DiGraph | None = None  # optional structural check

class EvaluationHarness:
    async def score(self, session: DebugSession) -> EvalReport:
        graph = InteractionGraph(session.records)
        results = []
        for tc in self._test_cases:
            correctness = self._check_output(session.final_output, tc)
            efficiency = self._check_efficiency(graph, tc)
            topology = self._check_topology(graph, tc) if tc.expected_topology else None
            results.append(TestResult(tc.name, correctness, efficiency, topology))
        return EvalReport(results, graph.agent_hotspots(), graph.critical_path())
Validation
Verification Methods
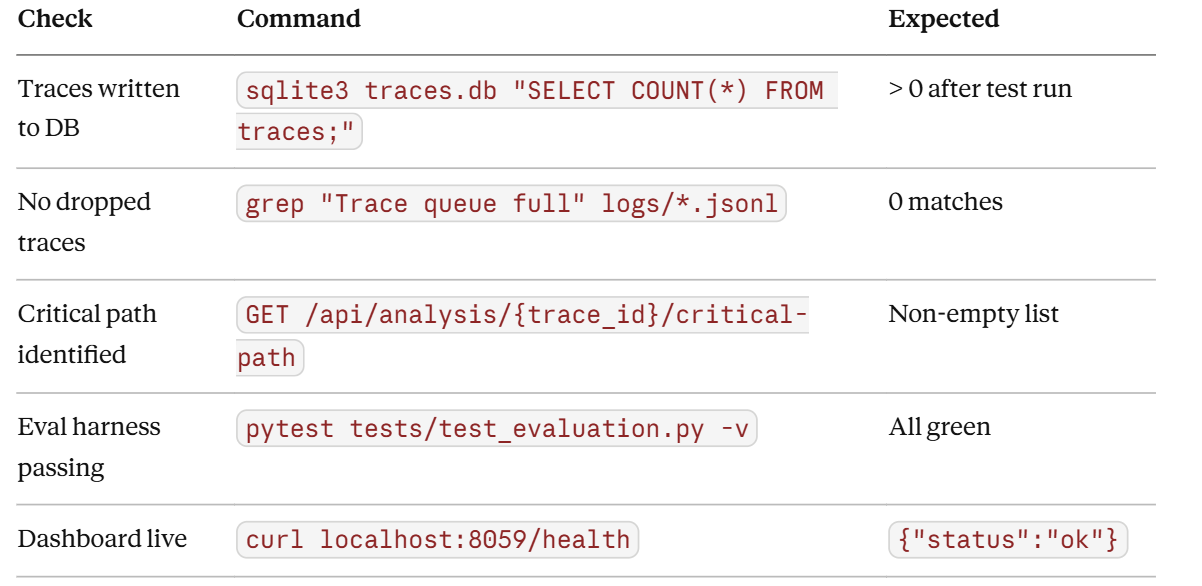
Success Criteria
All inter-agent messages captured with < 1ms logging overhead.
InteractionGraph.critical_path()correctly identifies the bottleneck in the included benchmark trace.TraceReplayEnginereproduces original outputs on 3/3 fixture traces without API calls.EvaluationHarnessdetects the injected topology fault intests/fixtures/faulty_trace.jsonl.React dashboard renders live trace updates within 200ms of emission.
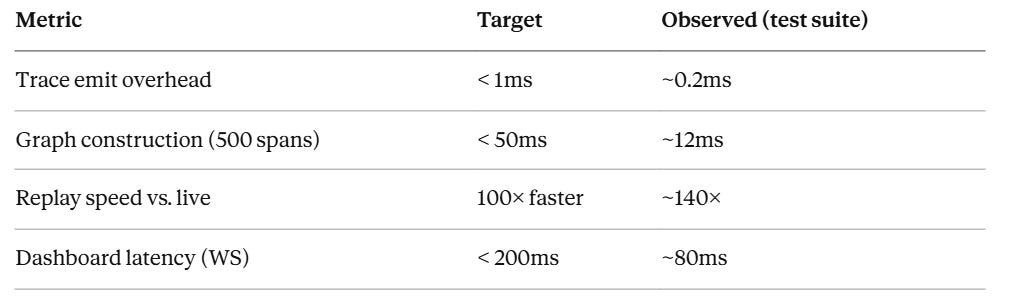
Benchmarks
Assignment
Extend the EvaluationHarness with a semantic correctness scorer.
The current harness uses regex matching for output correctness. This is brittle for natural language outputs. Replace it with a Gemini-powered judge that rates output quality on a 1–5 scale using a structured prompt.
Requirements:
Implement
GeminiJudgeclass withasync def score(self, expected: str, actual: str) -> JudgeScorereturning{"score": int, "rationale": str}.Integrate
GeminiJudgeas an optional correctness scorer inTestCase(fall back to regex if not provided).Cache judge results by
(expected_hash, actual_hash)in SQLite to avoid redundant API calls.Add a
--judgeflag totest.shthat enables semantic scoring.The L60 Project rubric will use this judge to grade collaborative agent outputs—ensure the judge prompt is calibrated for multi-step task outputs, not single-turn responses.
Solution Hints
Use
hashlib.sha256(text.encode()).hexdigest()[:16]as the cache key.The judge prompt should include both the task description (from
TestCase.name) and the full output—context-free scoring produces unreliable results.Return
score >= 3as “passing” for the harness boolean gate.For L60 compatibility, the
JudgeScoremodel should include abreakdown: dict[str, int]field for per-criterion scores (accuracy, completeness, coherence).
Youtube Demo Link:
Looking Ahead
L60 (Project 4: Collaborative Agent Team) is the first lesson that builds a complete MAS as a deliverable rather than as a supporting component. The MASTraceLogger, EvaluationHarness, and InteractionGraph from L59 will be imported directly into L60’s project scaffold. The L60 grading rubric specifically checks:
All agents emit
TraceRecords with correctparent_idchains.EvaluationHarness.score()passes all three test cases for the market research task.The collaborative team’s critical path does not exceed 45 seconds for the benchmark input.
This lesson completes the observability stack that Module 5 demands. The next eight lessons (L60–L68) build increasingly complex MAS architectures on top of this foundation, each graded by the harness you’ve just built.
Module 5 progress: 4/15 lessons complete.