
Introduction
This lesson adds observability to an AI service. Requests emit JSON and contribute latency measurements. RED metrics turn runtime behavior into operational signals. A dashboard presents percentiles, throughput, failures, routes, and events. Demo traffic proves telemetry changes when work executes.
Highlights
JSON logs with route, status, latency, and request IDs.
Thread-safe RED metrics with p50, p95, and p99 latency.
FastAPI dashboard with route counters and recent events.
Docker execution, health checks, demo traffic, and tests.
What We Build
An observability package containing logging, metrics, and service modules.
A latency histogram and synchronized in-memory metrics store.
Health, metrics, simulation, demo, and dashboard endpoints.
Docker lifecycle scripts and unit/API validation.
Connection to Previous Lesson
The previous lesson protected model output with scanning, redaction, and integrity checks. This lesson makes that service measurable and its reliability visible.
Enables Next Lesson
Error and latency signals establish the baseline for sandboxed code execution, making new resource pressure and failures visible.
Architecture Context
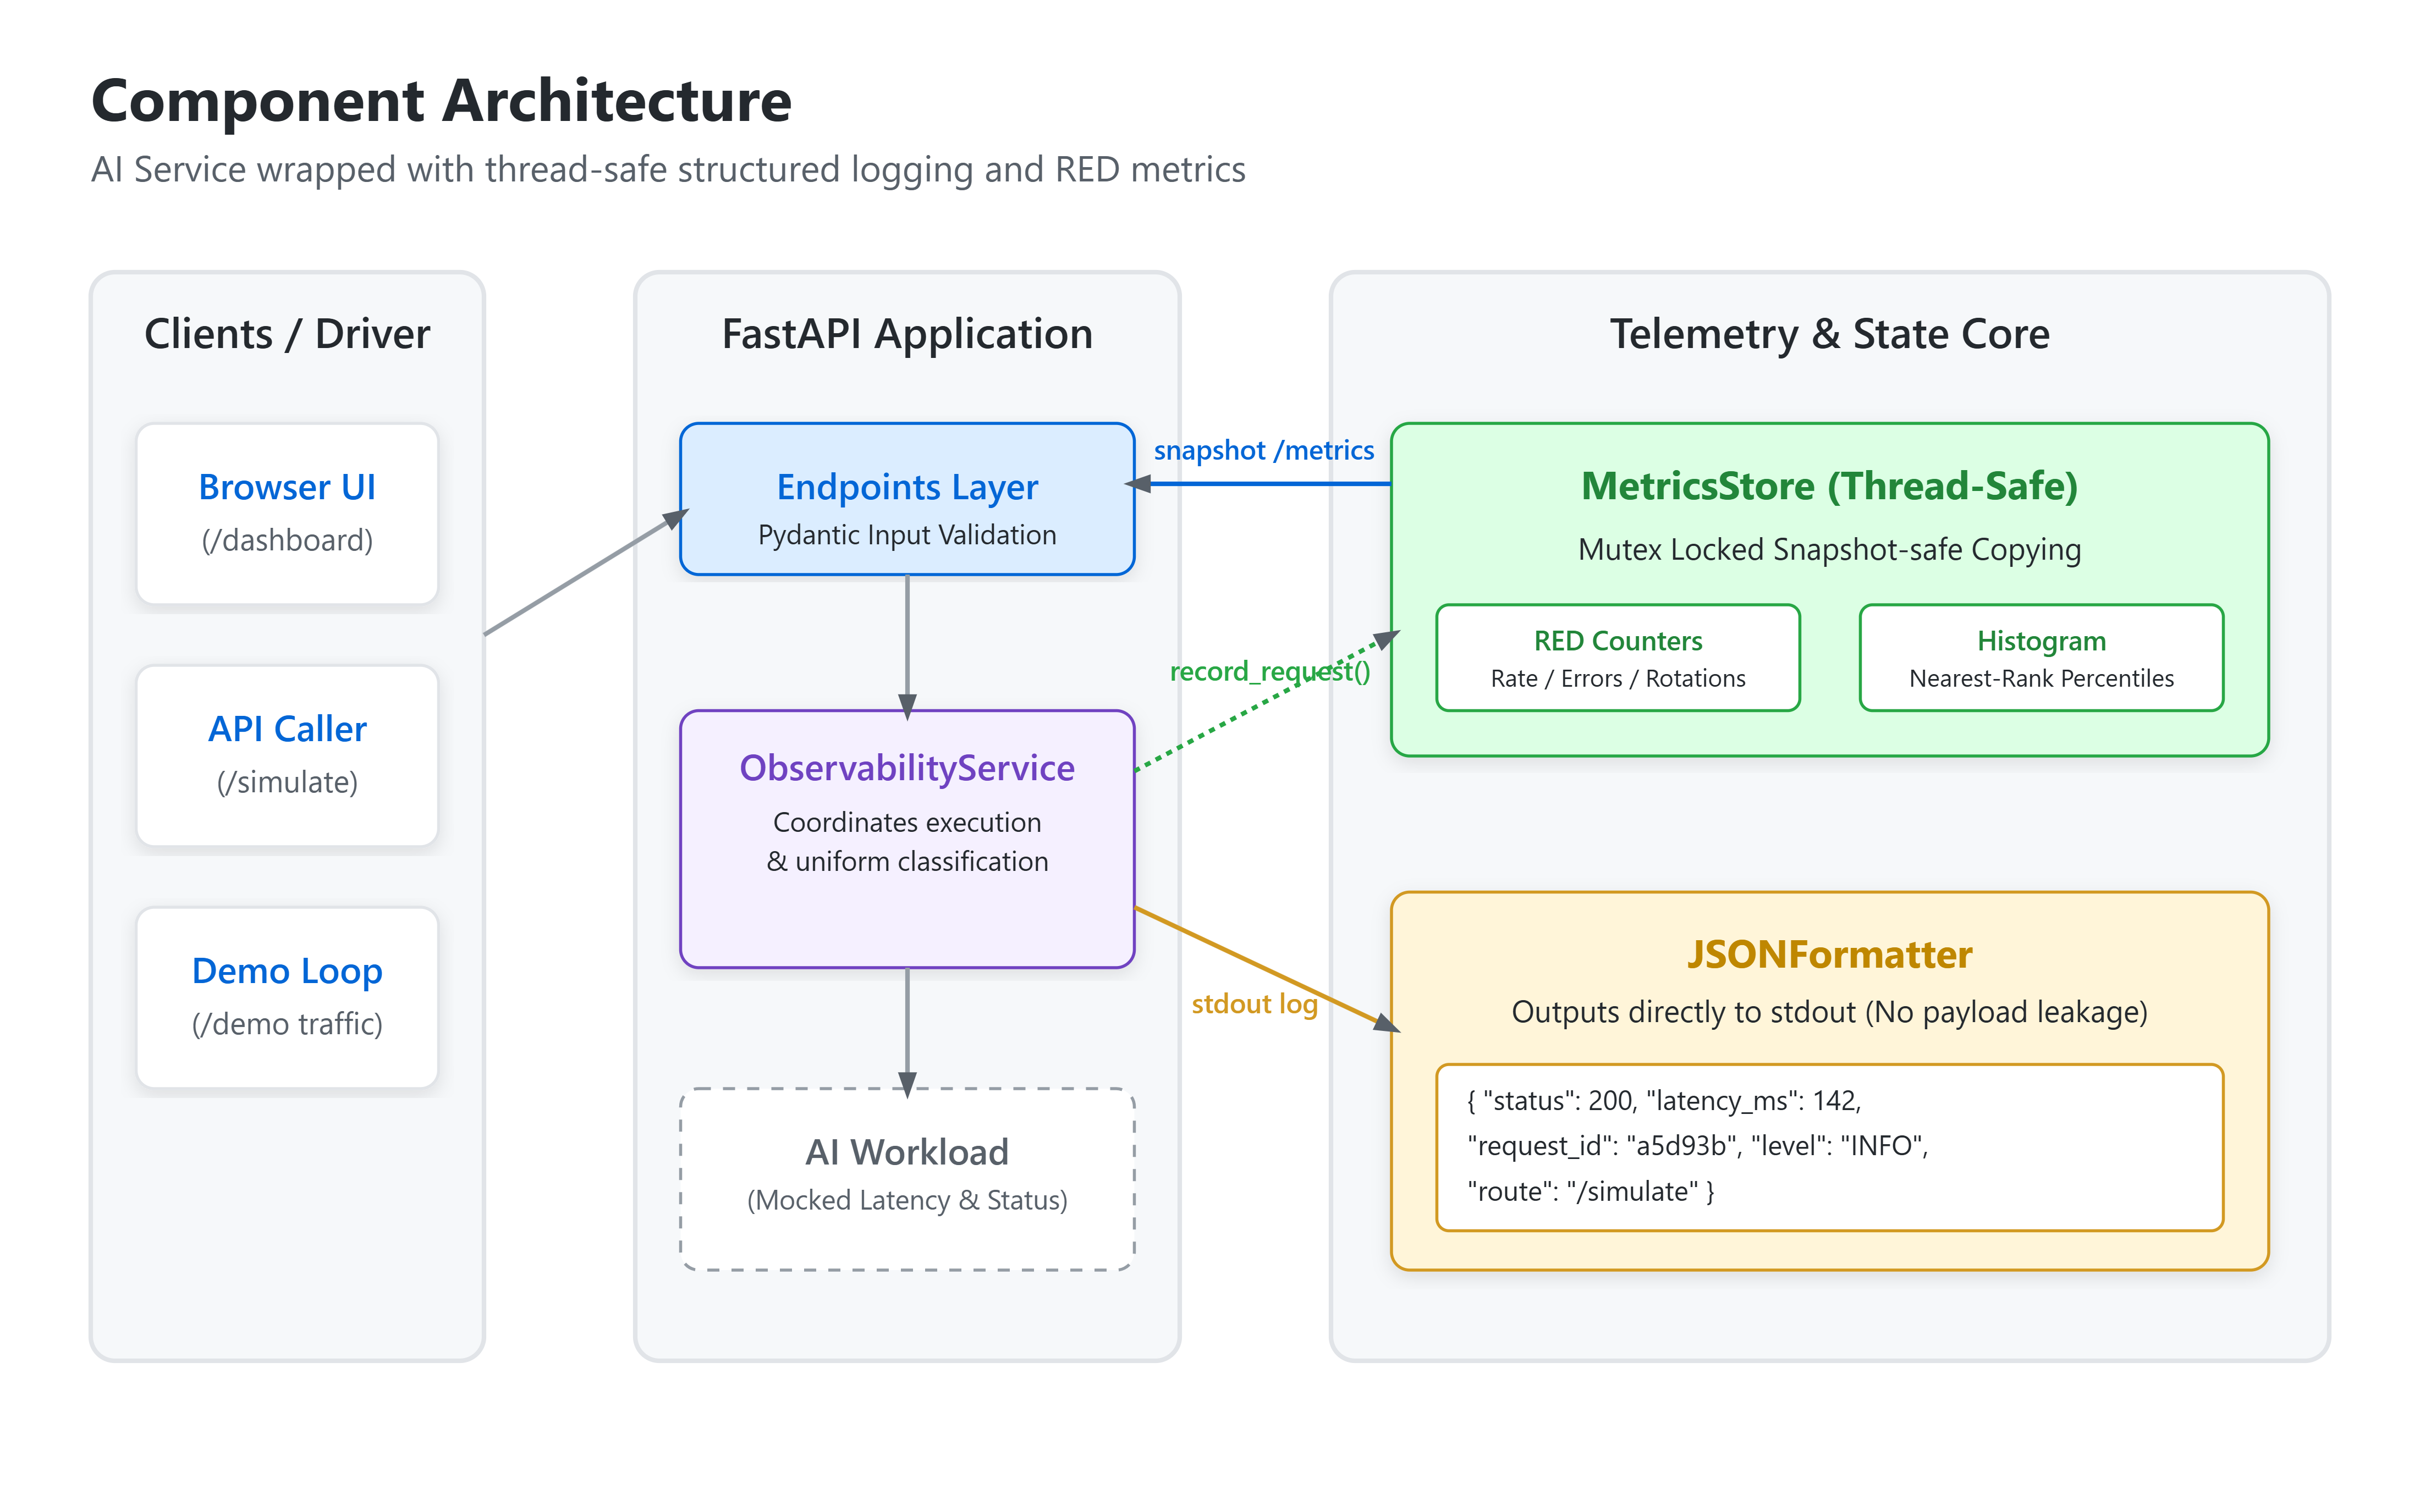
Where this component sits: at the HTTP request boundary, surrounding gateway and AI workload execution.
Why it exists: production failures include gradual latency growth and intermittent upstream errors, not only crashes.
Problem solved: opaque request handling becomes searchable events and quantitative service-health signals.
Integration
Integration Components
FastAPI delegates workload generation to ObservabilityService, with Pydantic validating input. The service writes each outcome to stdout and MetricsStore. The dashboard polls /metrics; /demo produces healthy, slow, and failed samples. Docker packages one reproducible worker.
Module Objectives Alignment
The implementation measures behavior, latency distribution, and error rate. Tests verify JSON fields, percentile ordering, APIs, dashboard availability, and demo metrics.
Core Concepts
Structured logging produces one JSON document per event, allowing direct field indexing. Route, status, latency, and request ID support correlation. Payloads are excluded because they may contain private data.
Latency averages hide long-tail behavior. Nearest-rank calculation sorts observations and selects the requested percentage rank. Production systems use bounded histogram buckets to control memory.
RED means Rate, Errors, and Duration: demand, reliability, and user-visible performance. Increased throughput is unhealthy when error rate and p99 also rise.
The lock keeps counters, histograms, and events coherent. Snapshot copies prevent partial UI reads. Multiple workers require centralized aggregation.
Production AI System Design Relevance
Observability belongs beside gateway middleware, measuring AI stages consistently. Its signals support SLOs, capacity planning, incidents, and deployments.
Workflow
Request flow: a caller opens the dashboard or invokes
/simulateor/demo; FastAPI validates input and calls the service.Execution flow: the service selects a route profile, derives latency and status, assigns severity, and creates a request ID.
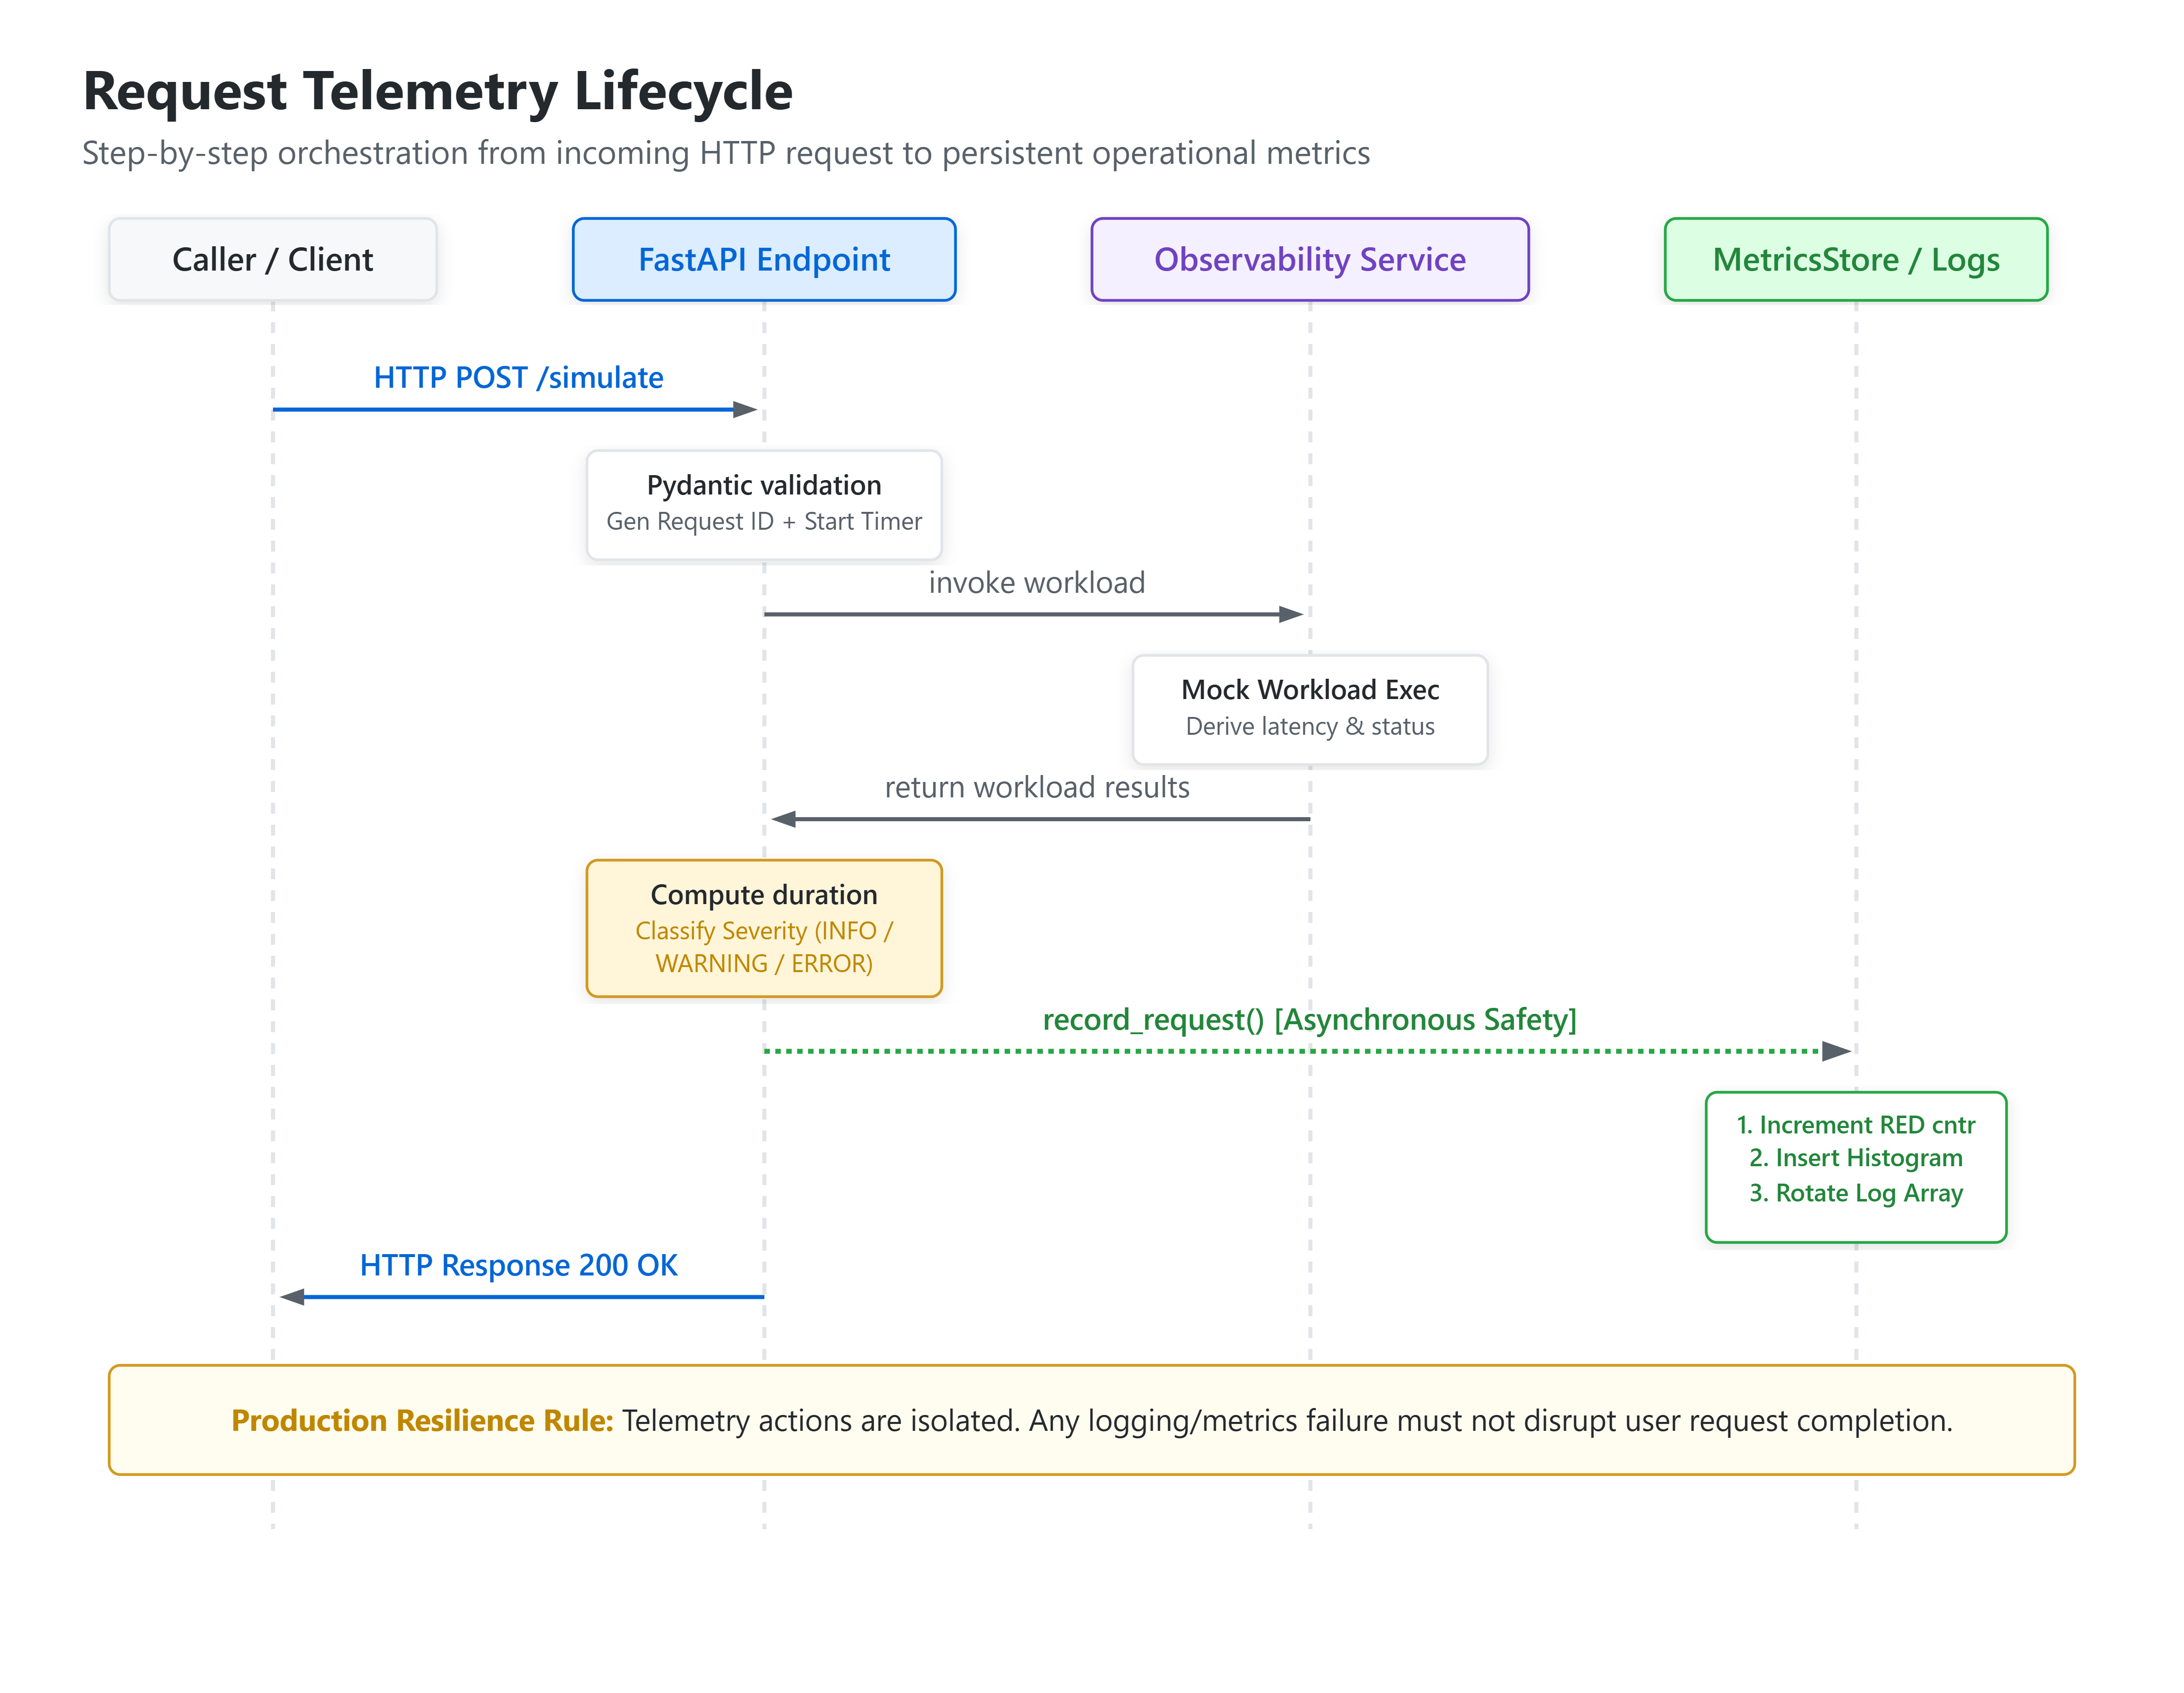
Data flow: metadata goes to stdout and the metrics store;
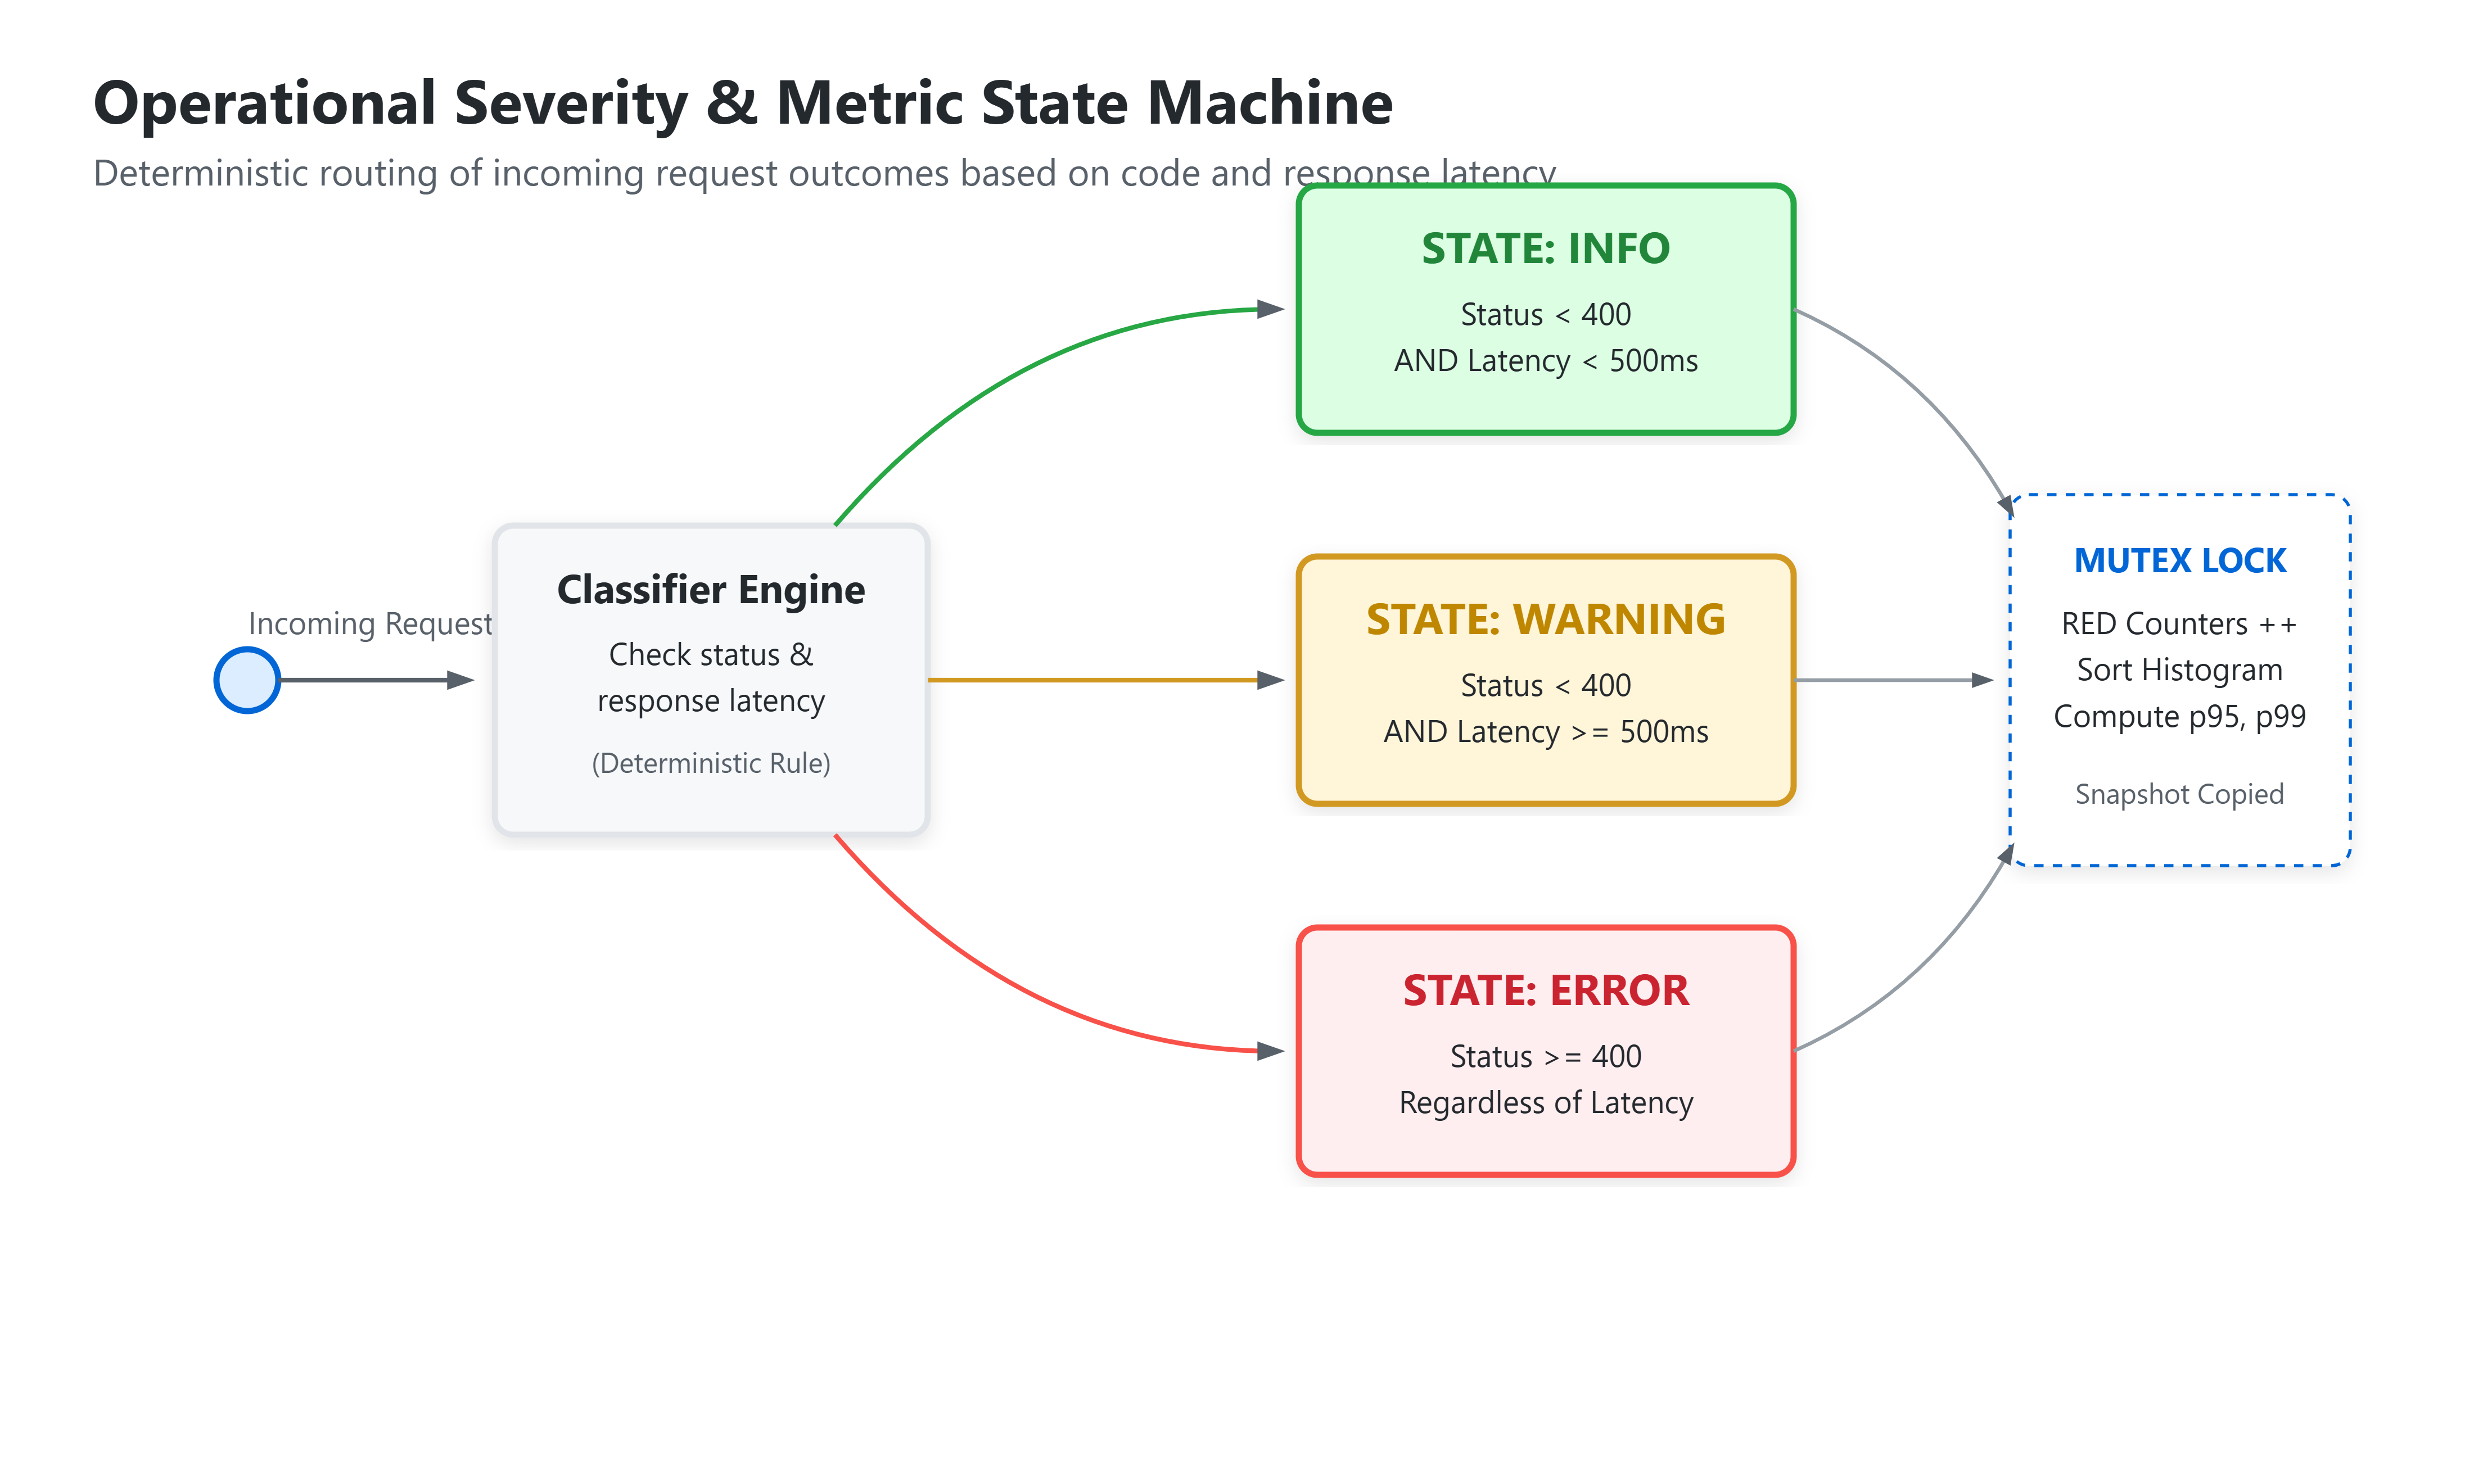
/metricsreturns snapshots rendered by the browser.State changes: counters increment, latency enters the histogram, percentiles recalculate, and recent events rotate.
Production Integration
Architecture fit: move timing and classification into gateway middleware.
Enterprise deployment: export through OpenTelemetry or Prometheus and ship stdout logs centrally.
Scalability: aggregate bounded histograms across replicas; never average computed percentiles.
Observability: alert on SLO burn rate, sustained errors, and tail latency.
Security: never log prompts, completions, authorization headers, or tenant secrets.
Step-by-Step Implementation
GitHub Link
https://github.com/sysdr/production-ai-engineering/tree/main/lesson6/aiam-day06
JSONFormatter converts records into stable fields. Logger setup removes prior handlers to prevent duplicates. Histogram owns percentile math; MetricsStore owns synchronization and history. ObservabilityService sends identical classifications to logs and metrics.
FastAPI exposes health, telemetry, simulation, demo, and dashboard routes. The browser consumes snapshots. Demo traffic includes known slow and failed samples, then healthy events. Pydantic rejects malformed input; tests cover histograms, formatting, APIs, and mutation.
Coding Highlights
Nearest-rank percentiles are deterministic:
rank = max(1, math.ceil((p / 100) * len(values)))
return sorted(values)[rank - 1]
Severity reflects both failure and slowness:
level = "ERROR" if status >= 400 else "WARNING" if latency >= 500 else "INFO"This separates slow success from outright failure, preserving operational meaning.
Working Demo Link:
Production Considerations
Scalability: bound histogram memory and label cardinality.
Security: redact sensitive fields and protect dashboard access.
Monitoring/logging: retain correlation IDs and alert on sustained SLO violations.
Testing: verify boundaries, formatter output, APIs, and demo metrics.
Failure handling: telemetry failure must not break user requests.
Edge cases: handle empty samples, concurrency, malformed labels, and downstream timeouts.
Validation
Verification: inspect JSON, call health and metrics endpoints, and compare pre/post-demo snapshots.
Testing strategy: unit tests cover math and formatting; API tests cover contracts and state.
Success criteria: all tests pass and dashboard values refresh after execution.
Expected outputs: ordered percentiles, non-zero RED metrics, and per-route totals.
Benchmarks: metric recording should remain sub-millisecond locally.
Production checklist: health green, labels bounded, secrets absent, retention defined, SLO load test passed.
Key Insights
Averages conceal tail pain; percentiles expose it. Structured fields improve investigations but increase cardinality. Common mistakes include logging payloads, unbounded labels, averaging percentiles, and letting telemetry failures affect users.
Important Classes
JSONFormatterrenders machine-readable events.Histogramcalculates latency percentiles.MetricsStoresynchronizes RED metrics.ObservabilityServicecoordinates execution and telemetry.
Key Methods
percentile()computes p50, p95, and p99.record_request()updates counters, latency, and events.run_demo()generates deterministic observable traffic.
Real-World Examples
A model gateway compares provider p95 latency and error rate, shifting traffic away from degradation before exhausting its SLO.
A retrieval pipeline correlates request IDs across search, reranking, and generation to isolate latency regressions.