Highlights
What we build
An
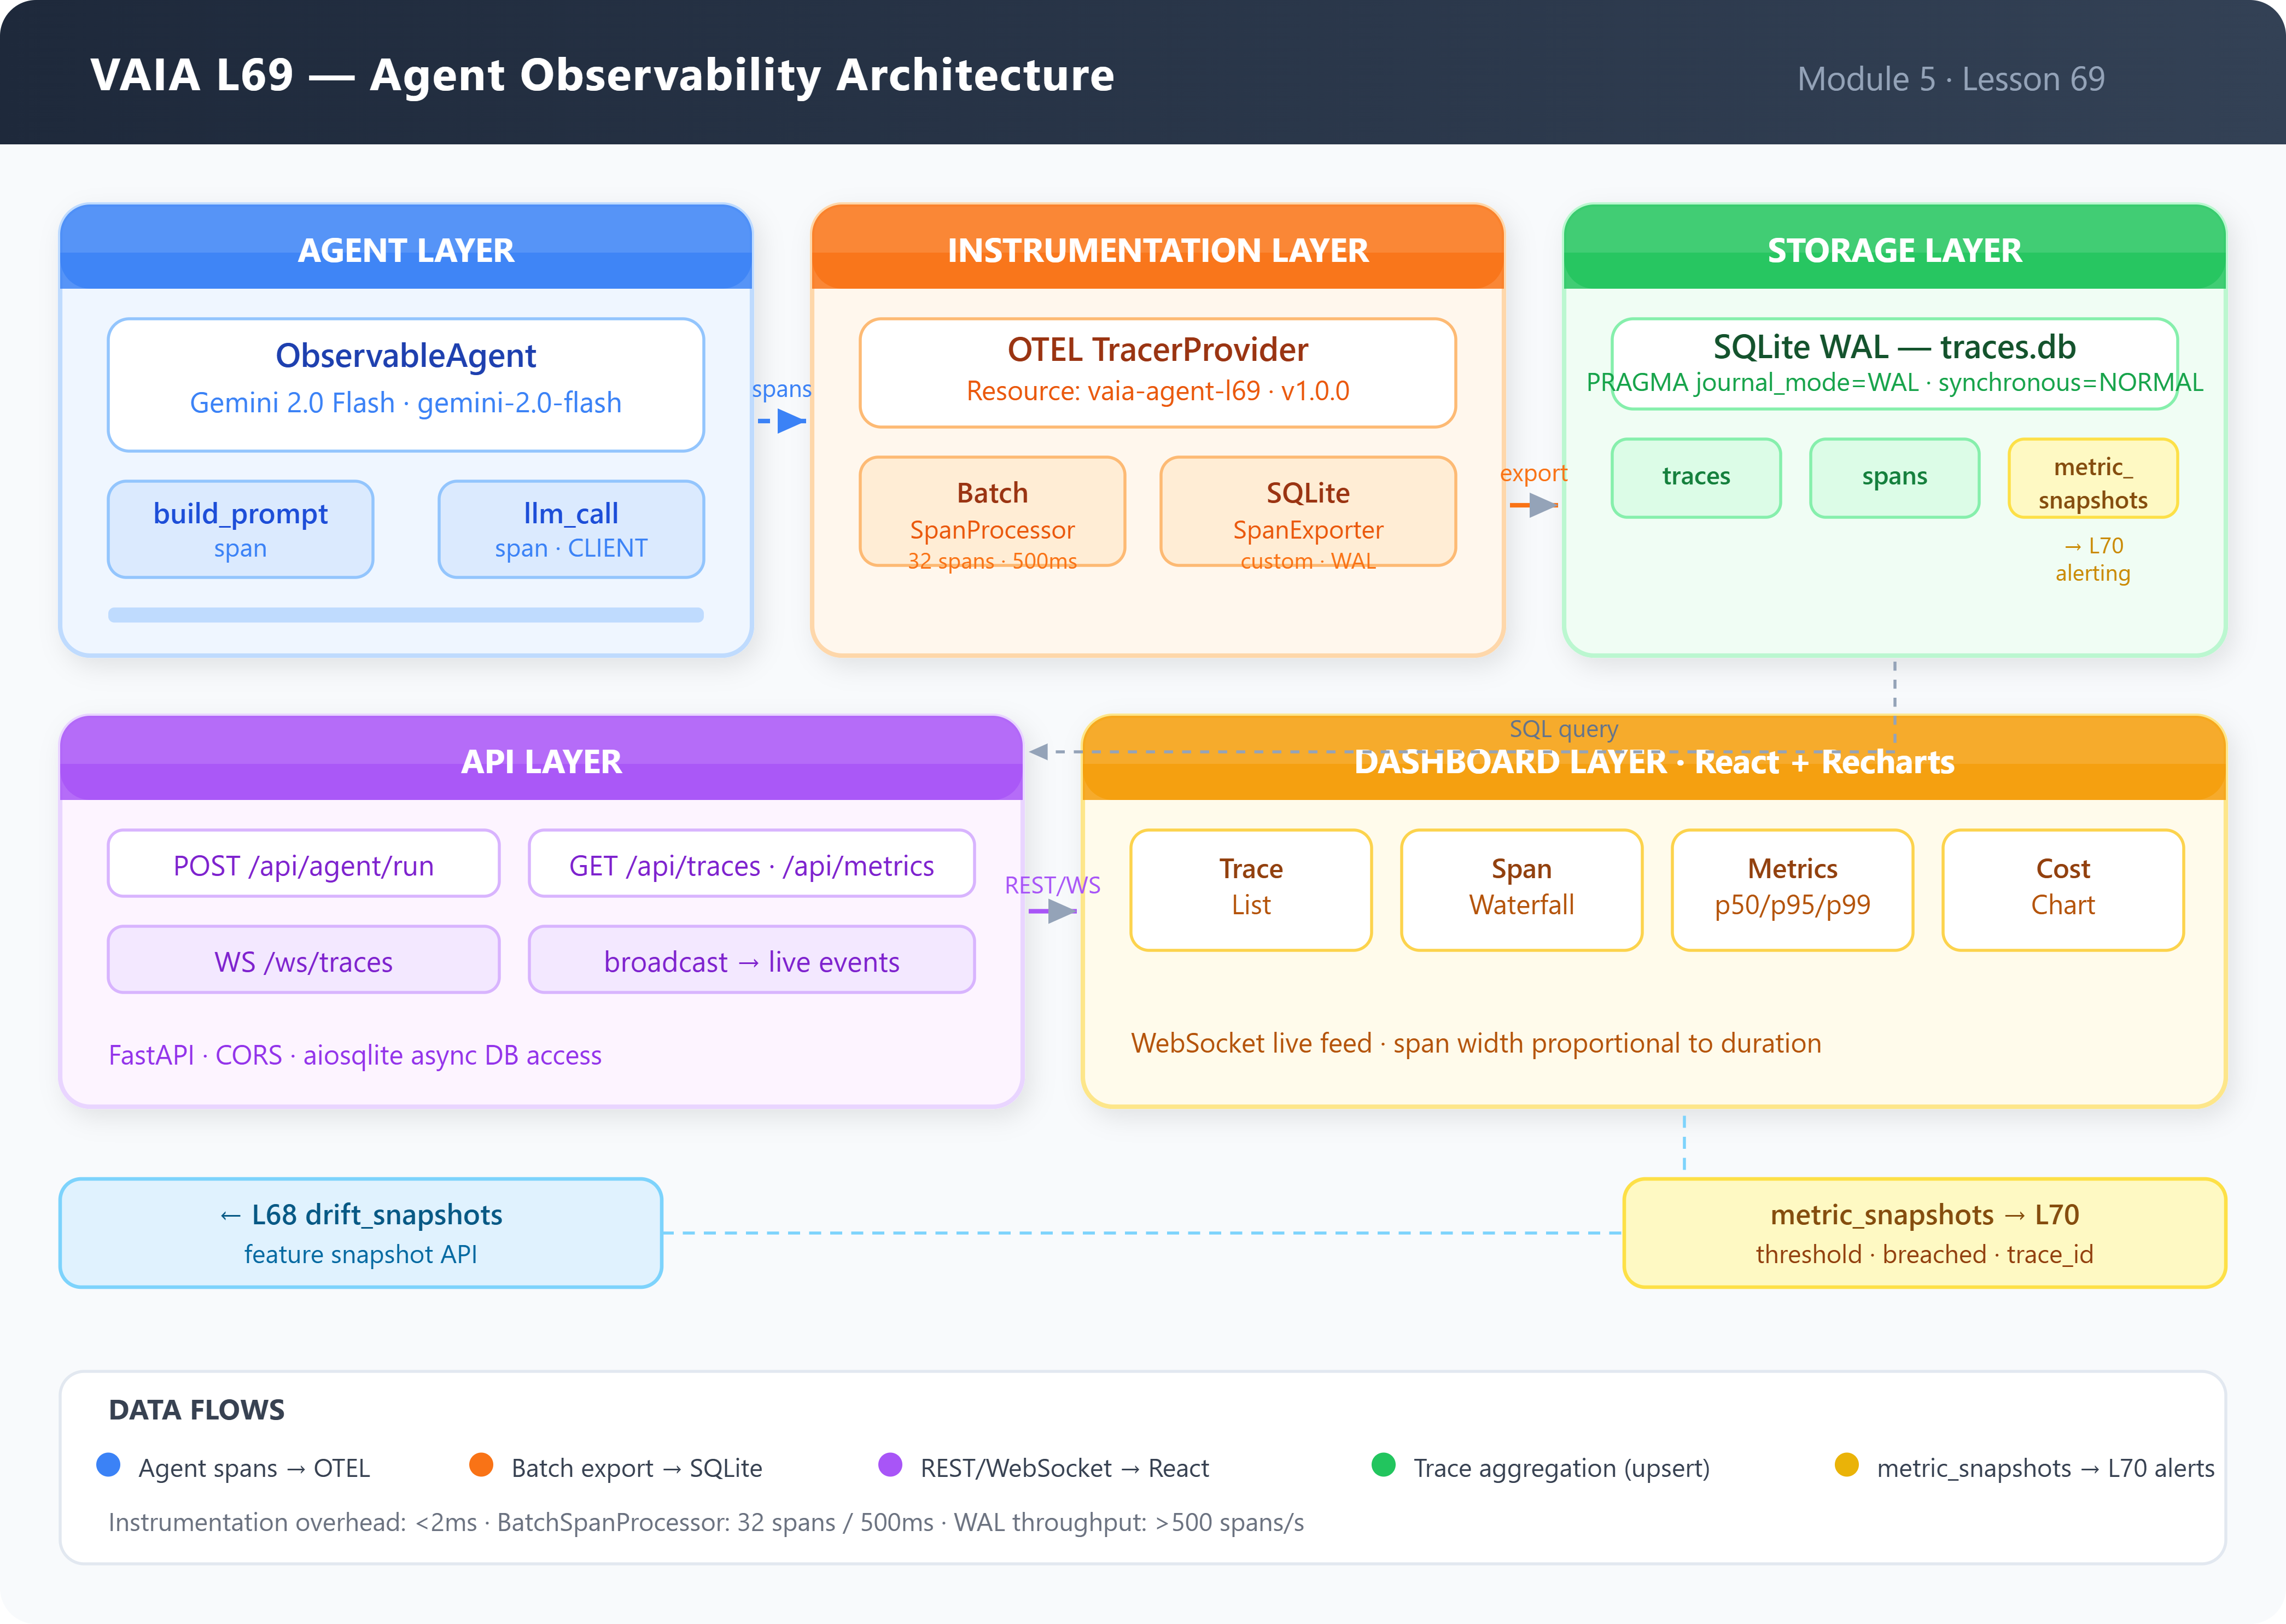
ObservableAgentwrapping Gemini 2.0 Flash where every execution step — prompt construction, LLM call, post-processing — is a named OTEL span with semantic attributesA
SQLiteSpanExporterthat persists spans to a WAL-mode SQLite database, replacing the need for an external collector during developmentA
metric_snapshotstable recording per-trace latency and cost with configurable thresholds — the direct feed for L70’s alerting systemA FastAPI service exposing trace list, span waterfall, and percentile metrics over REST and WebSocket
A React dashboard with a Jaeger-style span waterfall, real-time cost tracker, and p50/p95/p99 latency display
Connection to L68
L68 introduced thedrift_snapshotstable and feature snapshot API. L69 extends the same SQLite WAL database — addingtraces,spans, andmetric_snapshotstables — so a single query can correlate agent performance degradation (drift signals from L68) with the specific LLM calls that caused it (spans from L69).
Enables L70
The metric_snapshots table carries threshold, breached, and trace_id columns. L70’s alerting engine will query this table, match breached rows to span attributes, and fire notifications without any new instrumentation work.
Architecture Context
Place in the 90-lesson path
Lessons 61–68 built the MLOps control plane: CI/CD, model versioning, feature stores, continuous training, and drift detection. L69 closes the observability loop by making individual agent invocations inspectable. Without trace-level visibility, the drift signals from L68 are actionable only in aggregate — you know something degraded, but not which prompts, which spans, and what cost was involved.
Module 5 alignment
The module requires production-grade operability: the ability to diagnose problems quickly enough to meet enterprise SLAs. OTEL-based tracing is the industry-standard mechanism for this in distributed systems, and L69 adapts its primitives for the unique shape of LLM workloads (variable latency, token-denominated cost, prompt sensitivity).