
Highlights
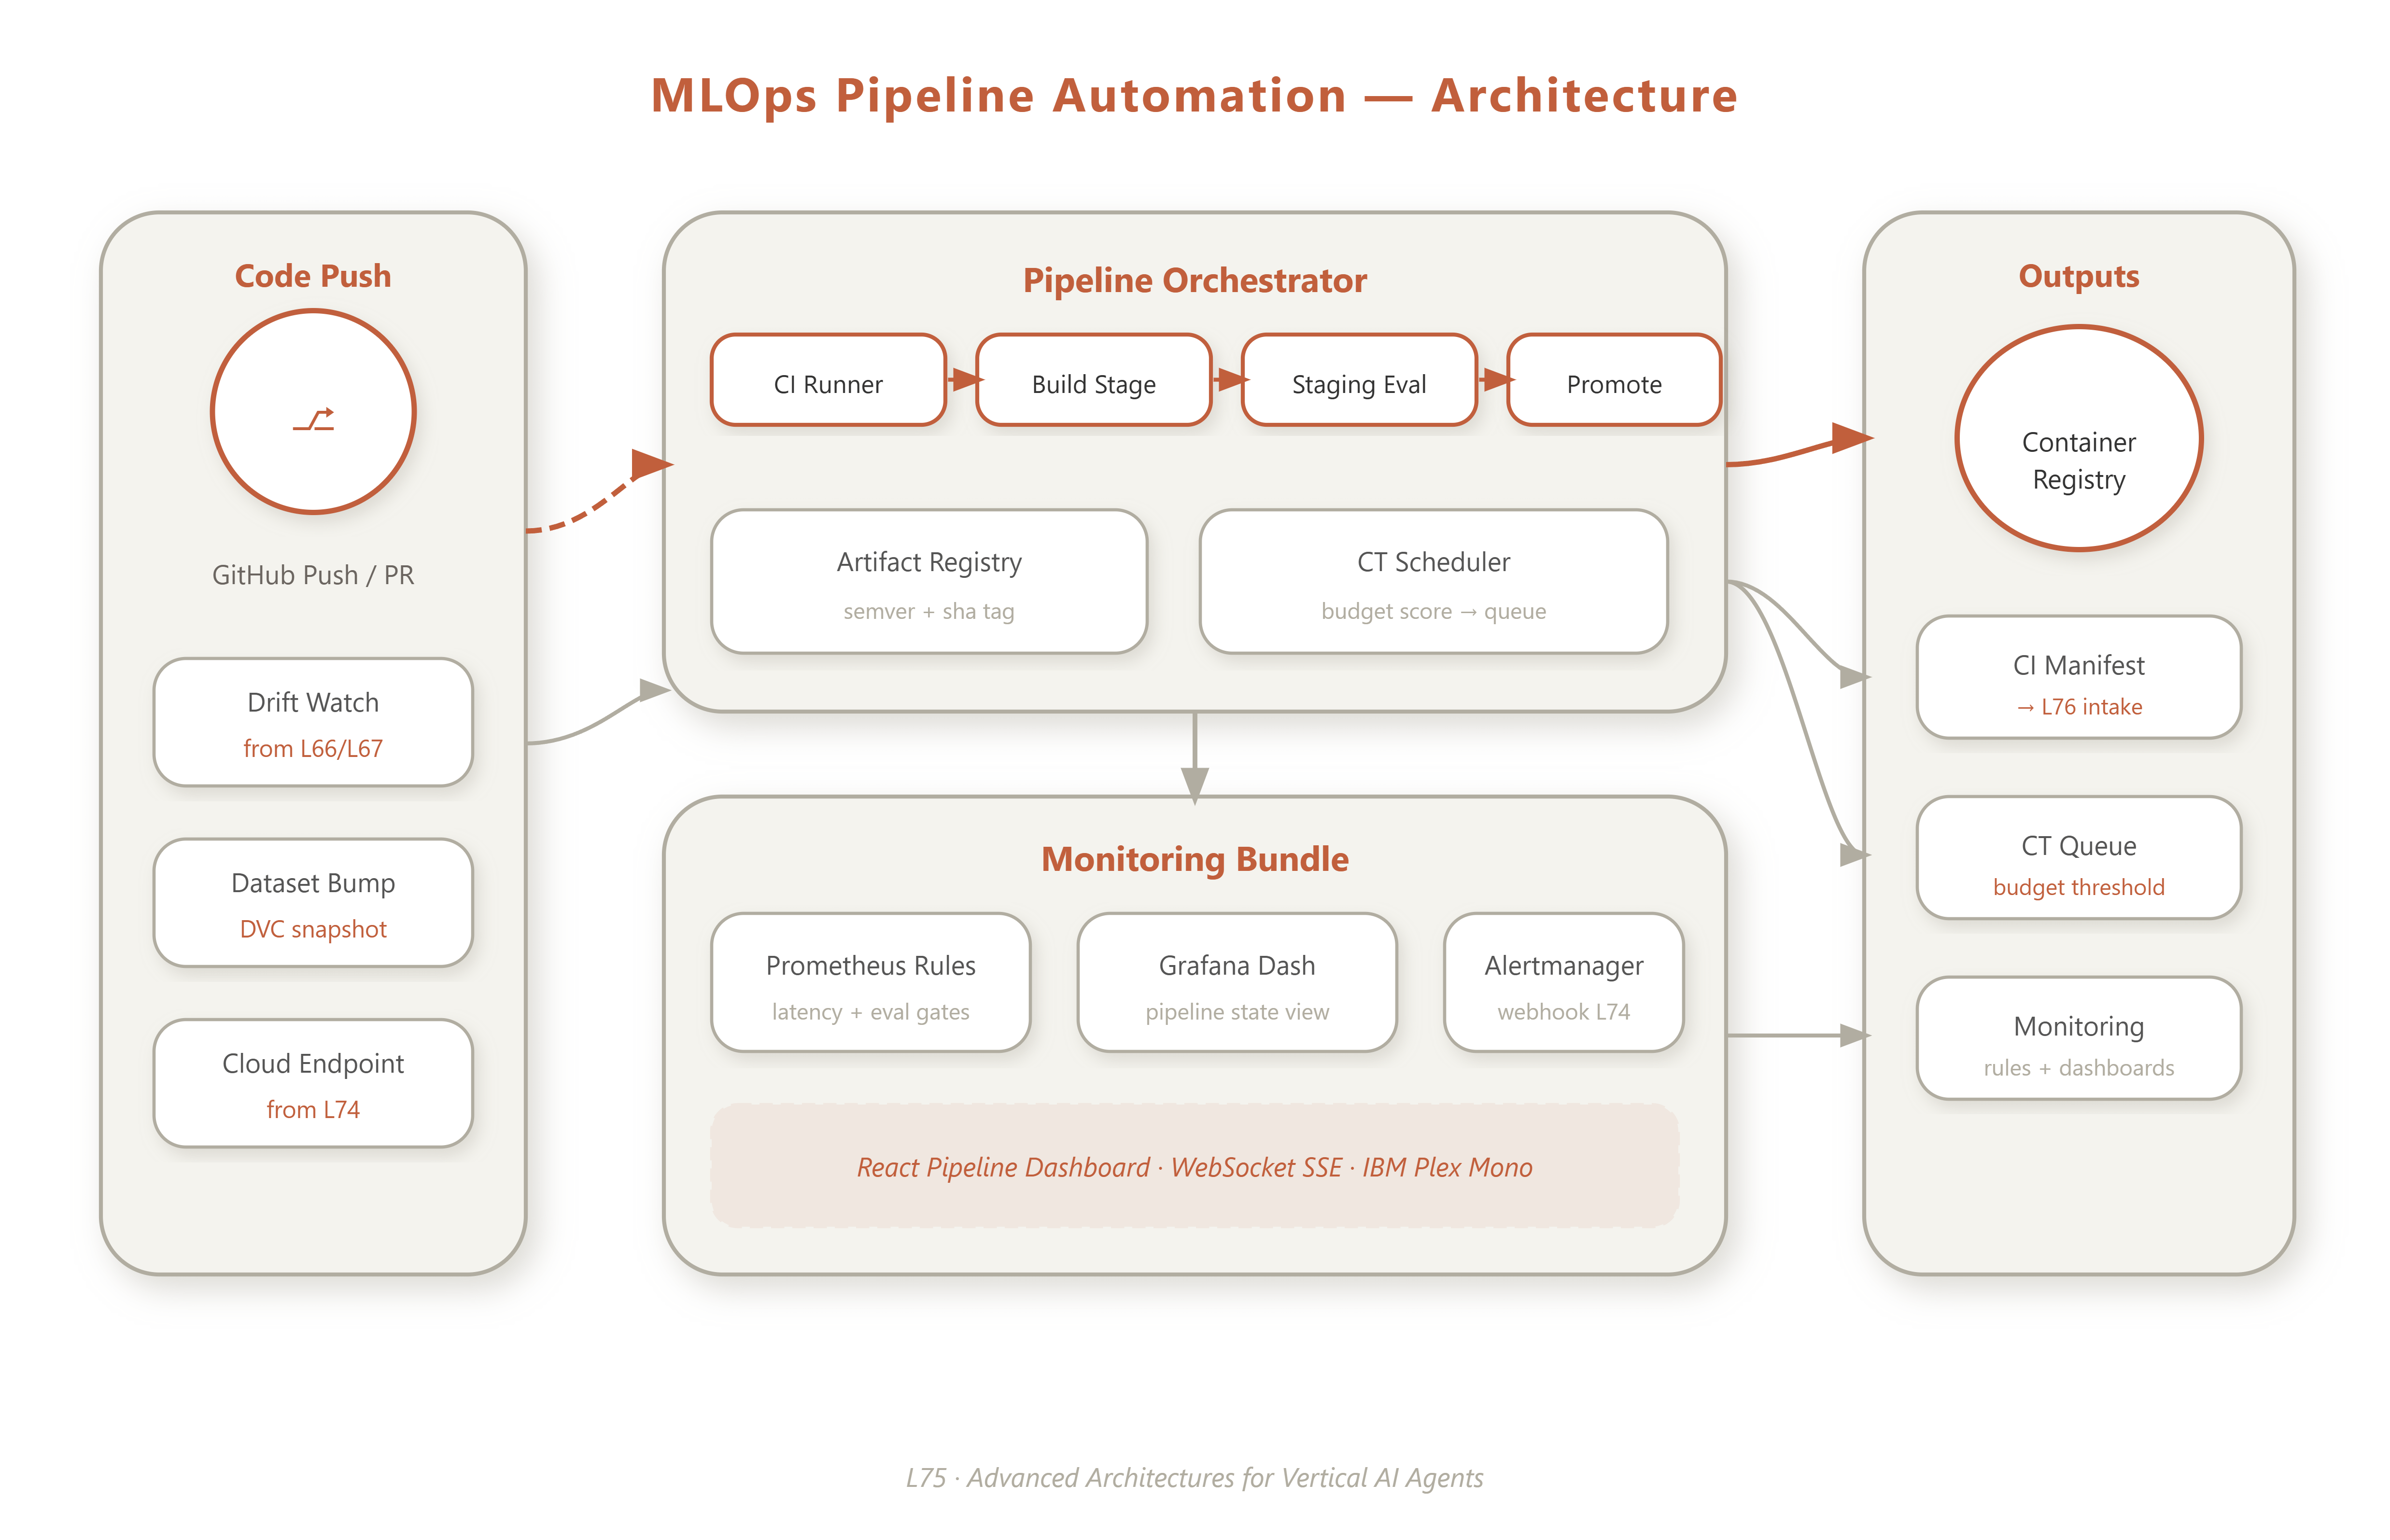
What we build: An end-to-end automated MLOps pipeline with a GitHub Actions CI workflow, multi-stage Docker build, Prometheus alerting config, a continuous training (CT) scheduler, and a React dashboard to visualize pipeline runs in real time.
Connection to L74: We consume the
DockerizedAgentServiceandDriftMonitorConfigproduced in L74’s cloud deployment, wiring them into a fully automated promotion pipeline rather than requiring manual triggers.Enables L76: The
ContinuousTrainingSchedulerandArtifactRegistrywe build here become the intake mechanism for L76’s domain-specific data ingestion scripts—new data arrives, the registry notices a version bump, and the CT scheduler queues a retrain.
Architecture Context
At position 75 of 90, we are consolidating the MLOps module. The prior five lessons gave us: drift detection (L66), data versioning (L67), containerization and CD (L64), high-throughput serving (L65), and a live cloud deployment (L74). L75 is the automation capstone—we wire every manual step into a single, policy-driven pipeline where no human touches a deployment button unless a quality gate explicitly demands it.
The VAIA-specific insight here is that agent pipelines carry a complexity burden that generic ML pipelines don’t: tool schema changes can silently break behavior even when model weights are unchanged. Our CI runner therefore runs a ToolSchemaValidator pass (first introduced in L63) as a mandatory gate before any build artifact is promoted.
Preparing for a distributed systems interview?
→Download the free Interview Pack
→ Subscribe now to access source code repository - 200 + coding lessons
Core Concepts
The Pipeline as a State Machine
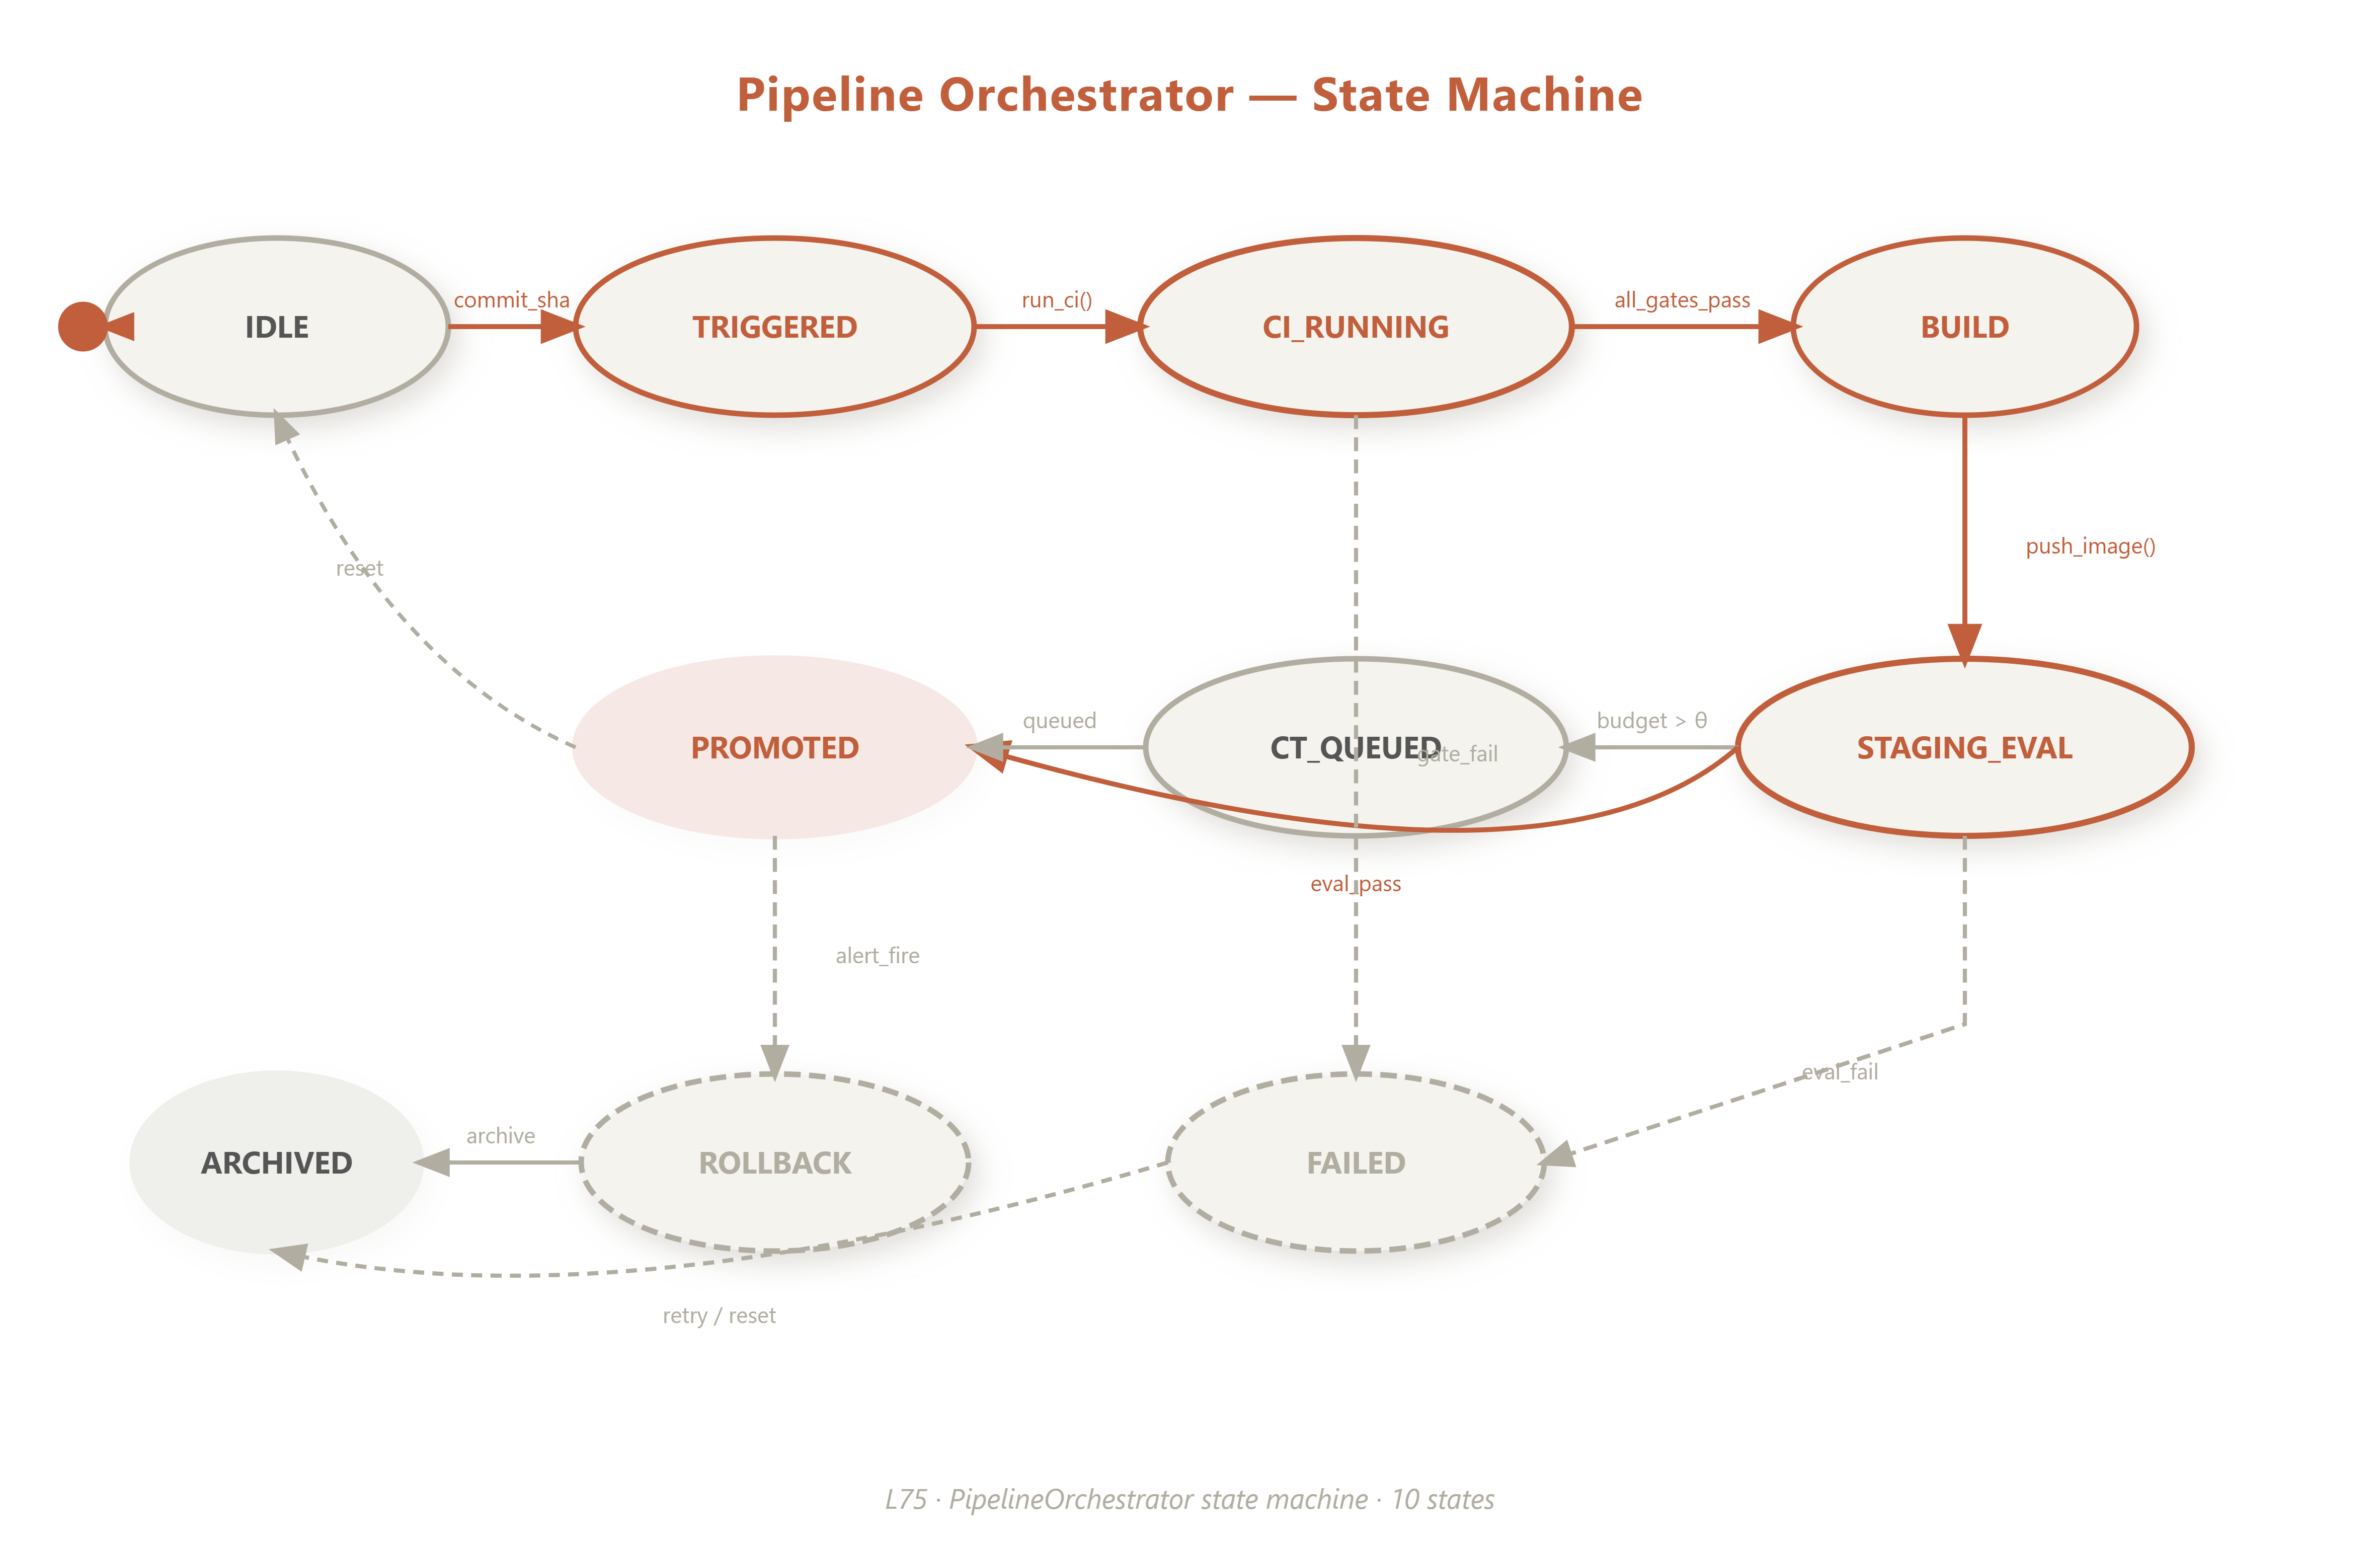
Every MLOps pipeline is implicitly a state machine. Making that state machine explicit is what separates a robust production pipeline from a collection of cron jobs. Our PipelineOrchestrator tracks seven named states: IDLE → TRIGGERED → CI_RUNNING → BUILD → STAGING_EVAL → CT_QUEUED → PROMOTED (with FAILED and ROLLBACK as escape hatches). Each transition has a guard condition and an entry action that emits a Prometheus metric.
CI Gating for Agent Logic
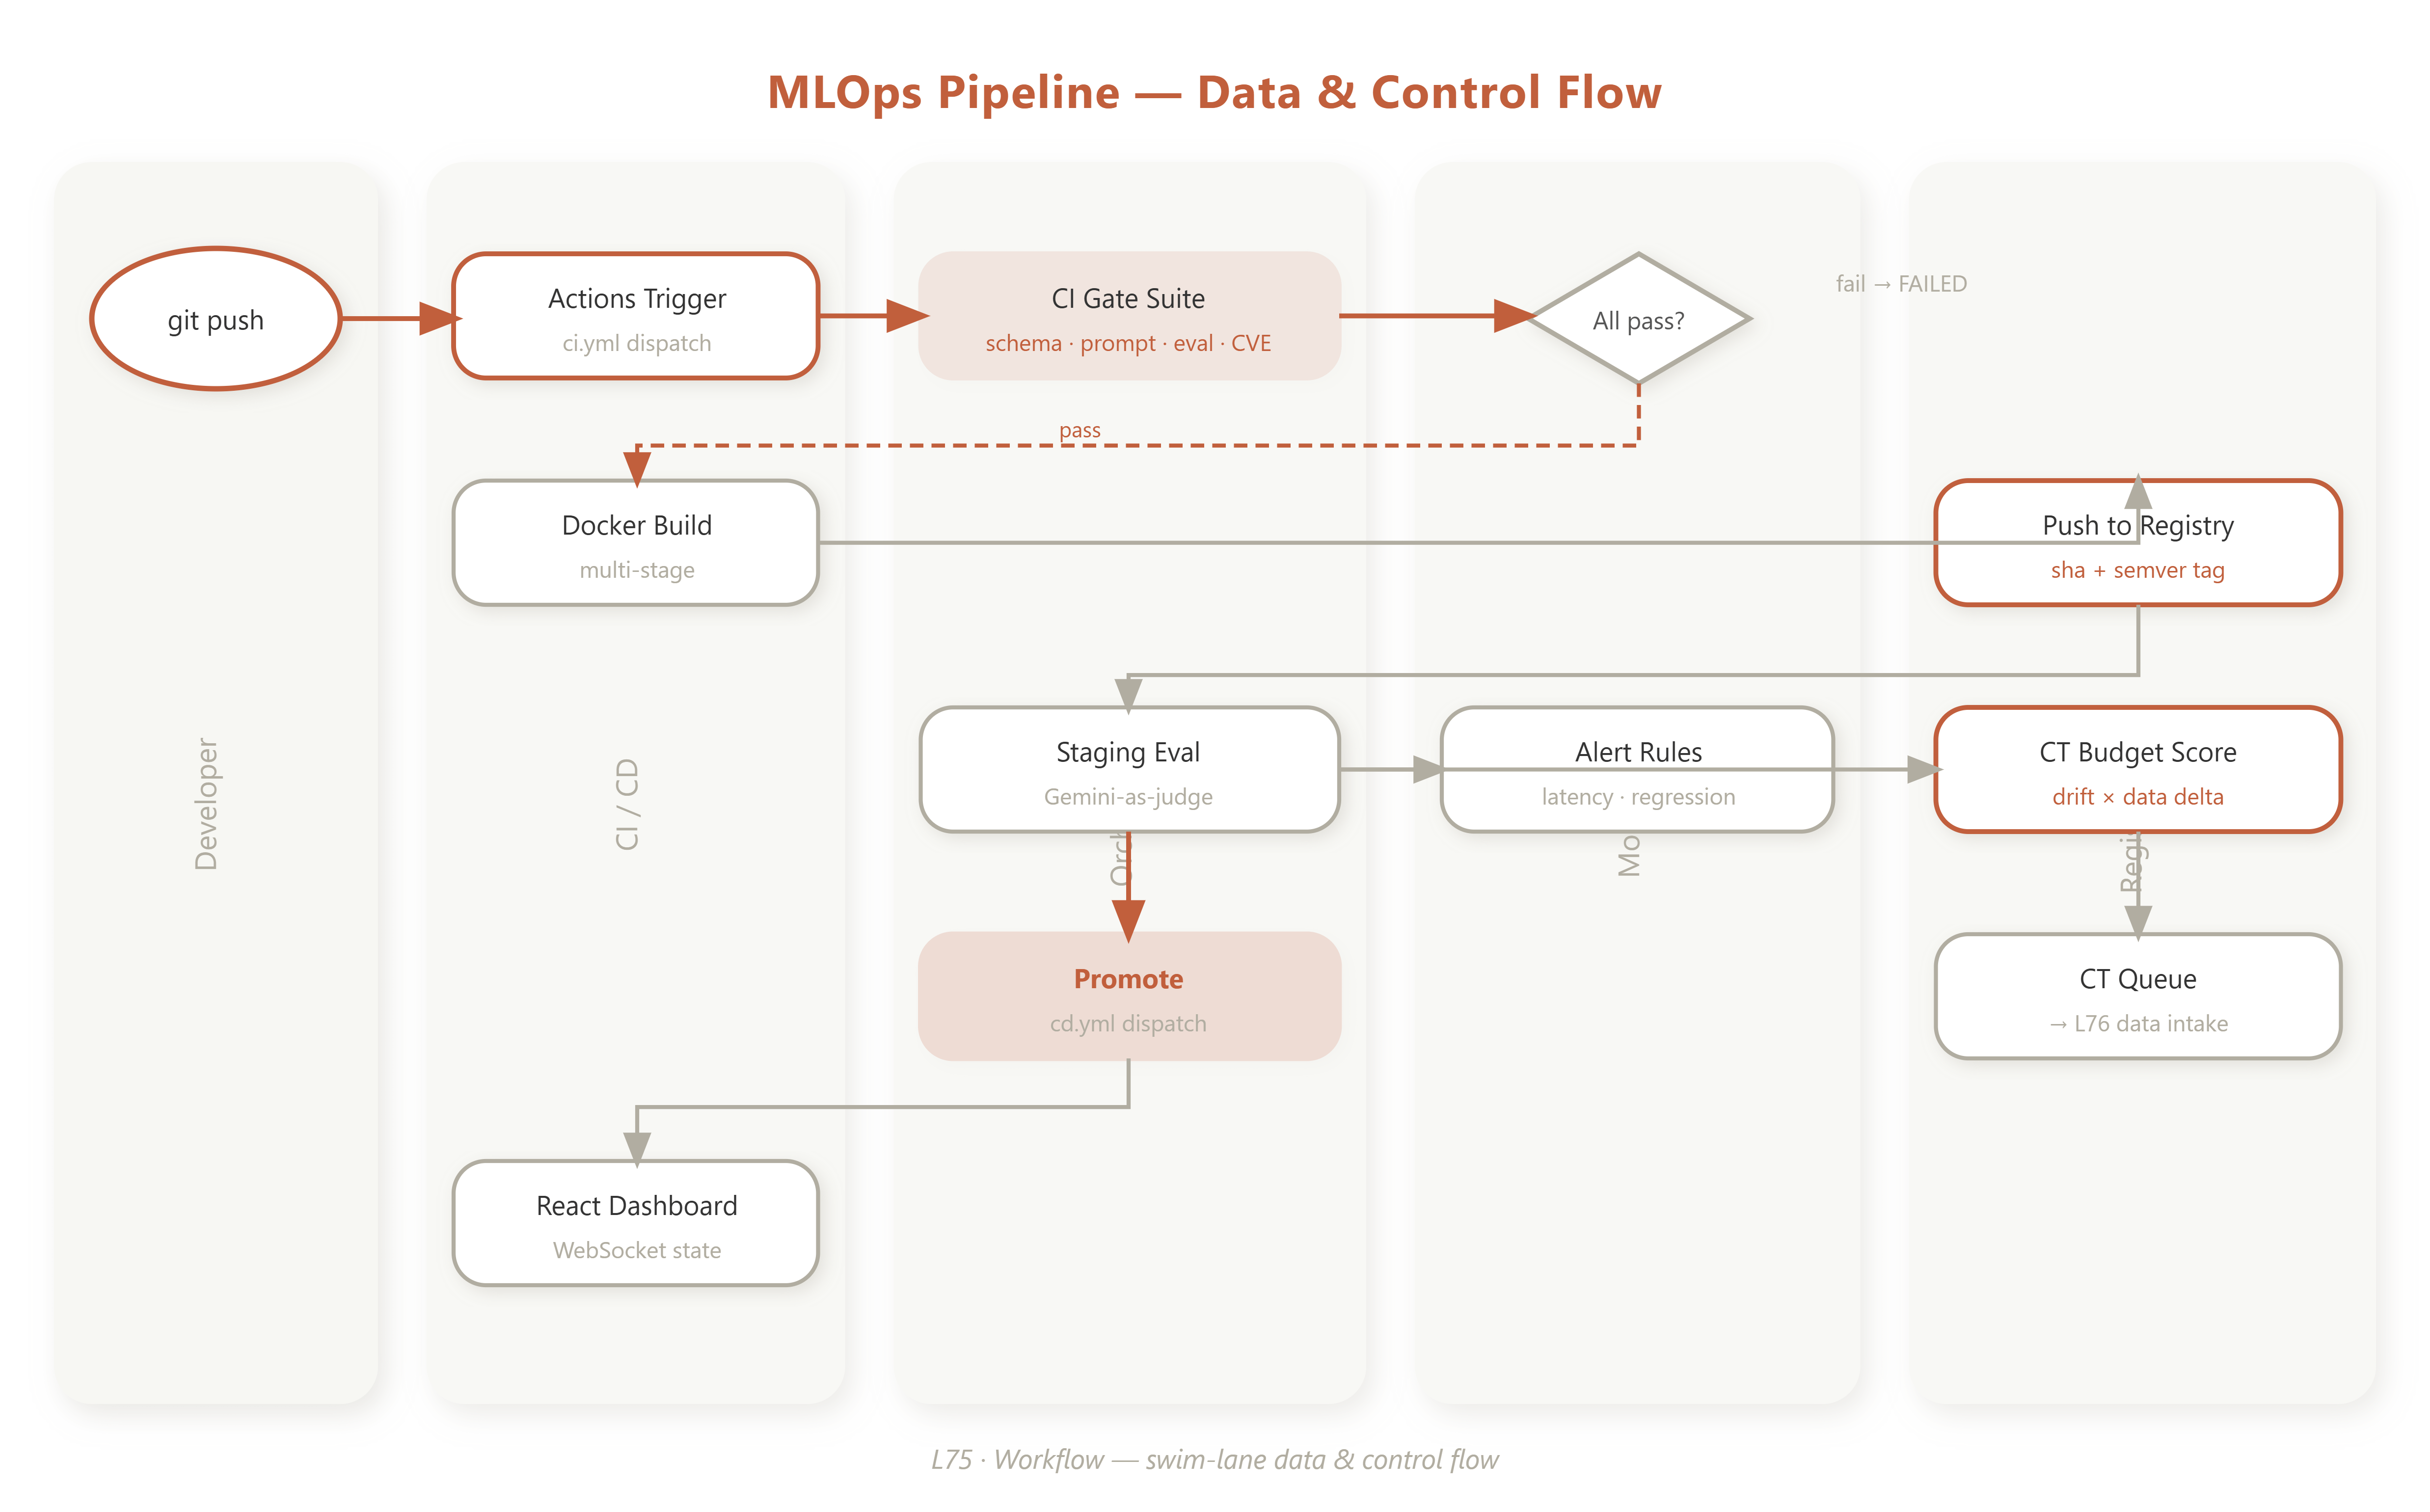
For VAIA systems, CI must validate more than unit tests. The four mandatory gates are:
Schema validity — tool definitions round-trip through JSON Schema without mutation.
Prompt robustness — adversarial prompt injection attempts fail to exfiltrate system context.
Regression delta — Gemini-as-judge scores on the golden eval set don’t drop more than 2 percentage points vs. the current prod model.
Security scan — Trivy finds no CRITICAL CVEs in the new image layer.
Only when all four gates are green does the build artifact get pushed to the container registry.
Continuous Training Readiness vs. Continuous Training
An important distinction: L75 builds CT readiness, not a full fine-tuning loop. The ContinuousTrainingScheduler watches the artifact registry for new dataset snapshots (produced by L67’s DVC versioning), computes a “training budget” score from drift magnitude and dataset delta size, and emits a CT_QUEUED event when the score exceeds a threshold. The actual Gemini fine-tune call happens in a downstream job—here, we wire the trigger and the queue.
Integration
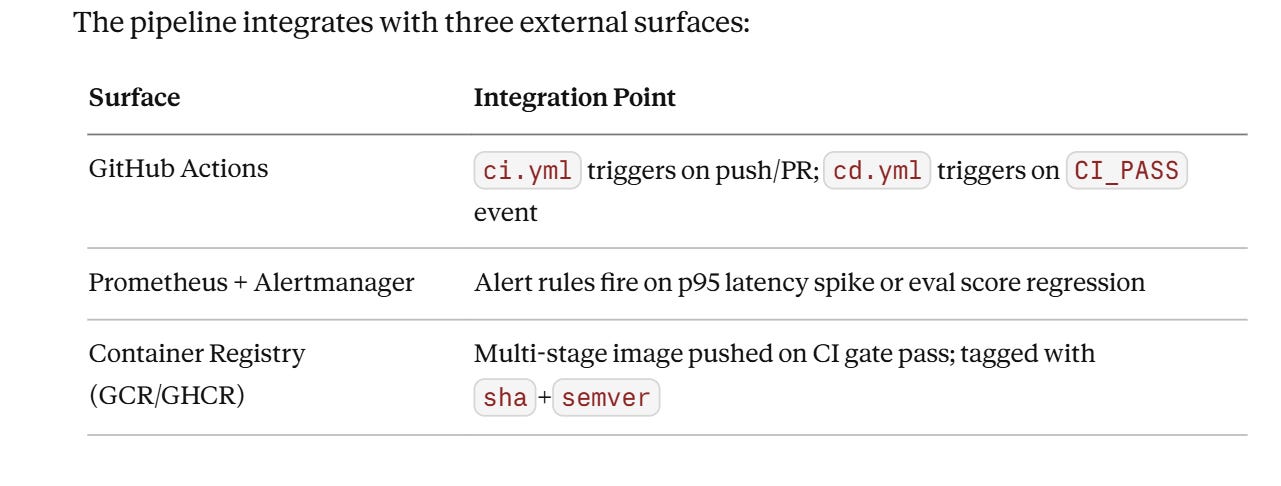
The pipeline integrates with three external surfaces:
Implementation
GitHub link
https://github.com/sysdr/vertical-ai-agent-p/tree/main/lesson75/l75-mlops-pipeline
Component Architecture
PipelineOrchestrator
├── CIStepRunner
│   ├── ToolSchemaValidator  (from L63)
│   ├── PromptRobustnessHarness  (from L63)
│   ├── GeminiEvalRegressor
│   └── TrivySecurityScanner
├── ArtifactRegistry
│   ├── DVCSnapshotWatcher  (from L67)
│   └── SemVerTagger
├── ContinuousTrainingScheduler
│   ├── DriftBudgetCalculator  (from L66)
│   └── TrainingQueueEmitter
└── MonitoringConfigBundle
    ├── PrometheusRuleGenerator
    └── GrafanaDashboardExporter
Control Flow
Pipeline State Machine
Coding Highlights
Explicit state transitions with guards
python
class PipelineOrchestrator:
    TRANSITIONS = {
        PipelineState.TRIGGERED: (
            PipelineState.CI_RUNNING,
            lambda ctx: ctx.commit_sha is not None
        ),
        PipelineState.CI_RUNNING: (
            PipelineState.BUILD,
            lambda ctx: ctx.ci_result.all_gates_passed
        ),
        # ...
    }

    async def advance(self, ctx: PipelineContext) -> PipelineState:
        target, guard = self.TRANSITIONS[self.state]
        if not guard(ctx):
            await self._transition(PipelineState.FAILED, ctx)
            raise GateFailure(f"Guard failed at {self.state}")
        await self._transition(target, ctx)
        return self.state
CT budget scoring
python
def compute_training_budget(drift_score: float, dataset_delta_rows: int) -> float:
    # Weighted combination: drift magnitude + data volume signal
    drift_weight = 0.6
    data_weight = 0.4
    normalized_data = min(dataset_delta_rows / 10_000, 1.0)
    return drift_score * drift_weight + normalized_data * data_weight
Prometheus alert rule (generated, not hardcoded)
python
def generate_latency_alert(threshold_ms: int = 500) -> dict:
    return {
        "alert": "AgentP95LatencyHigh",
        "expr": f"histogram_quantile(0.95, agent_request_duration_seconds_bucket) * 1000 > {threshold_ms}",
        "for": "2m",
        "labels": {"severity": "warning"},
        "annotations": {"summary": "Agent p95 latency exceeded {{ $value }}ms"}
    }
Assignment
Extend the CIStepRunner to add a fifth gate: latency regression. Load the p95 baseline from the previous build’s Prometheus snapshot; fail the gate if the new build’s Locust benchmark (L65) regresses by more than 15%.
Build toward L76: Add a DataSourceWatcher stub to the ContinuousTrainingScheduler that polls a configurable S3/GCS prefix for new raw files. When a new file lands, it should increment a pending_data_volume_bytes Prometheus gauge. L76 will replace this stub with real ingestion logic.
Solution Hints
The latency gate baseline should be fetched from a Prometheus range query, not stored in a file—this keeps baselines in sync with your monitoring system automatically.
For the
DataSourceWatcher, useasyncio.create_taskinside FastAPI’s lifespan to run the polling loop without blocking the main thread.
YouTube link:
Looking Ahead
L76 Vertical Adaptation Strategies: Data Sourcing picks up the DataSourceWatcher stub and replaces it with a real ingestion pipeline for unstructured domain data—financial PDFs, medical journals, legal contracts. The ContinuousTrainingScheduler we built here becomes the consumer of that pipeline: new data lands → registry version bumps → CT budget crosses threshold → retrain queues automatically. This is the moment the VAIA stops being a static deployed model and starts being a self-improving vertical specialist.
Module progress: 17 of 18 planned MLOps lessons complete. After L76 we enter Module 7: Domain Specialization.